Field breakdown
The field breakdown plugin for isolate databases displays the frequency of each value for fields, alleles and schemes.
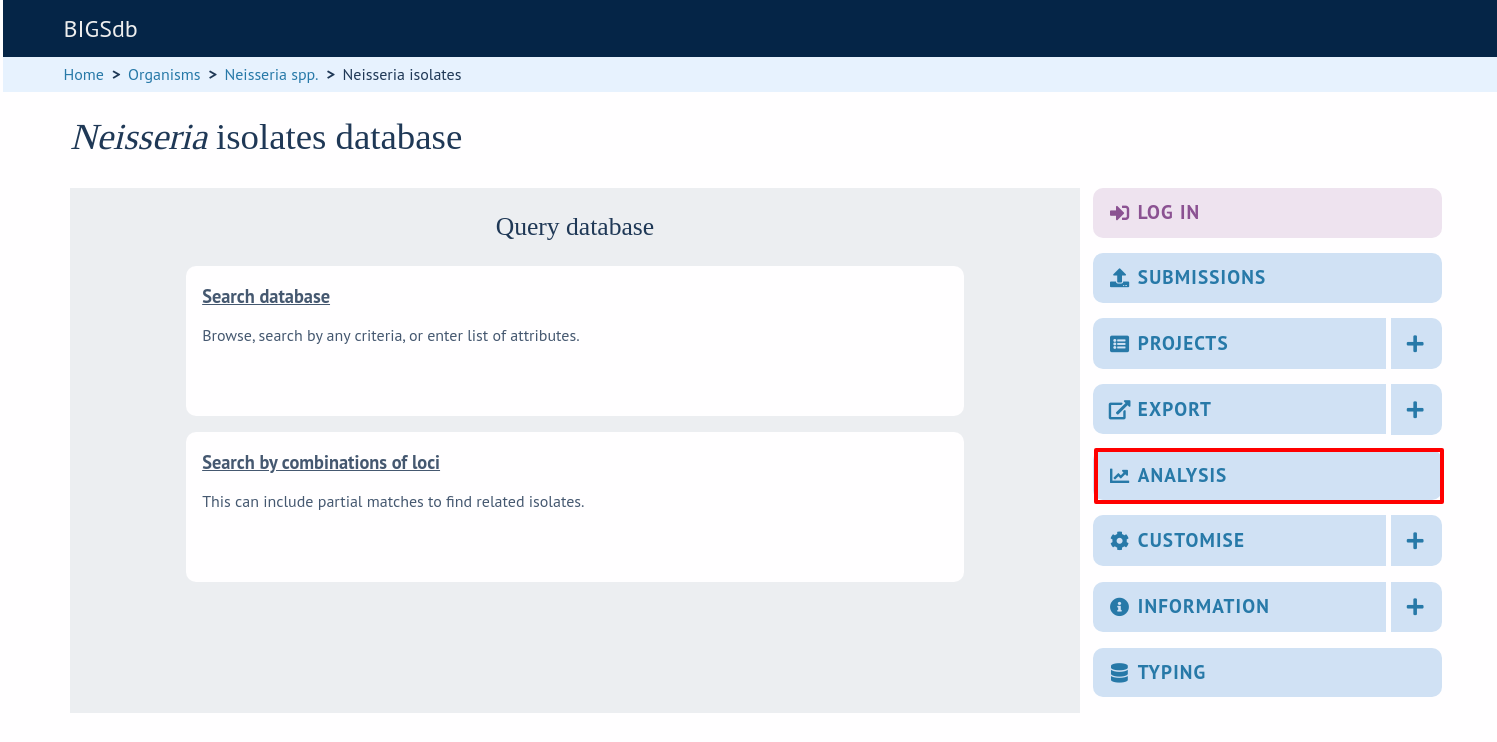
The function can be accessed by selecting the ‘Analysis’ section on the main contents page.
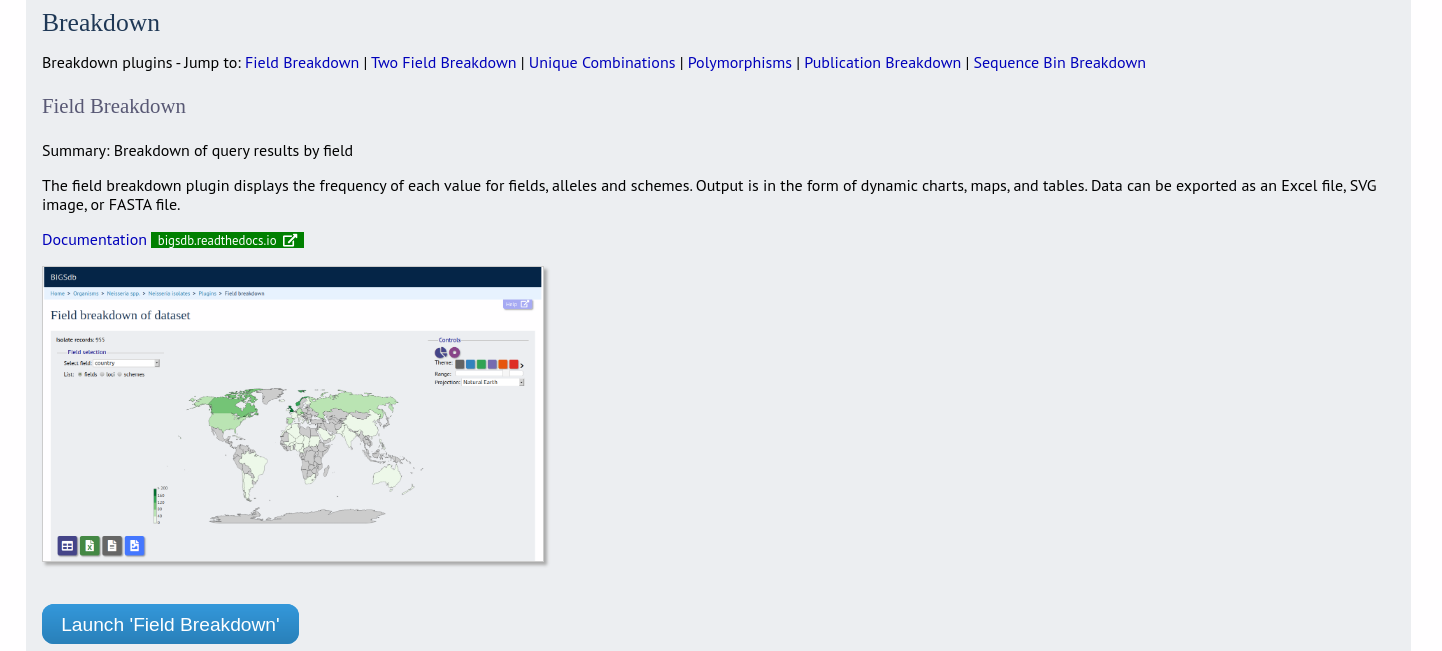
In the ‘Breakdown’ category, follow the link to ‘Field Breakdown’, then click ‘Launch Field Breakdown’.
The breakdown function can be selected for the whole database by clicking the ‘Single field’ link in the Breakdown section of the main contents page.
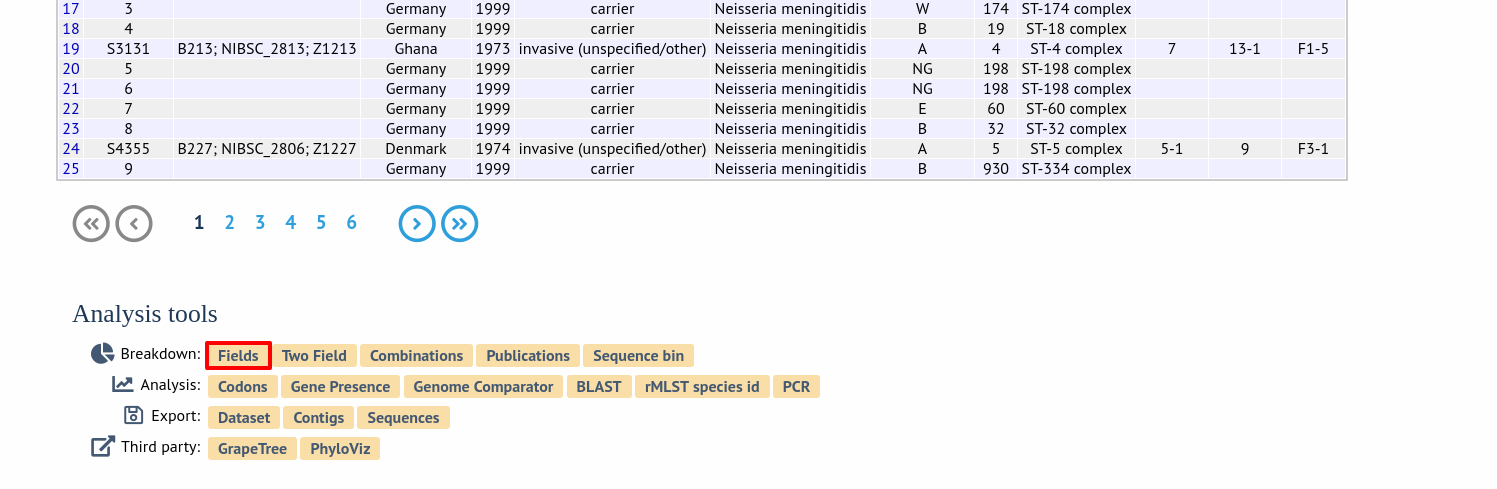
Alternatively, a breakdown can be displayed of the dataset returned from a query by clicking the ‘Fields’ button in the Breakdown list at the bottom of the results table. Please note that the list of functions here may vary depending on the setup of the database.
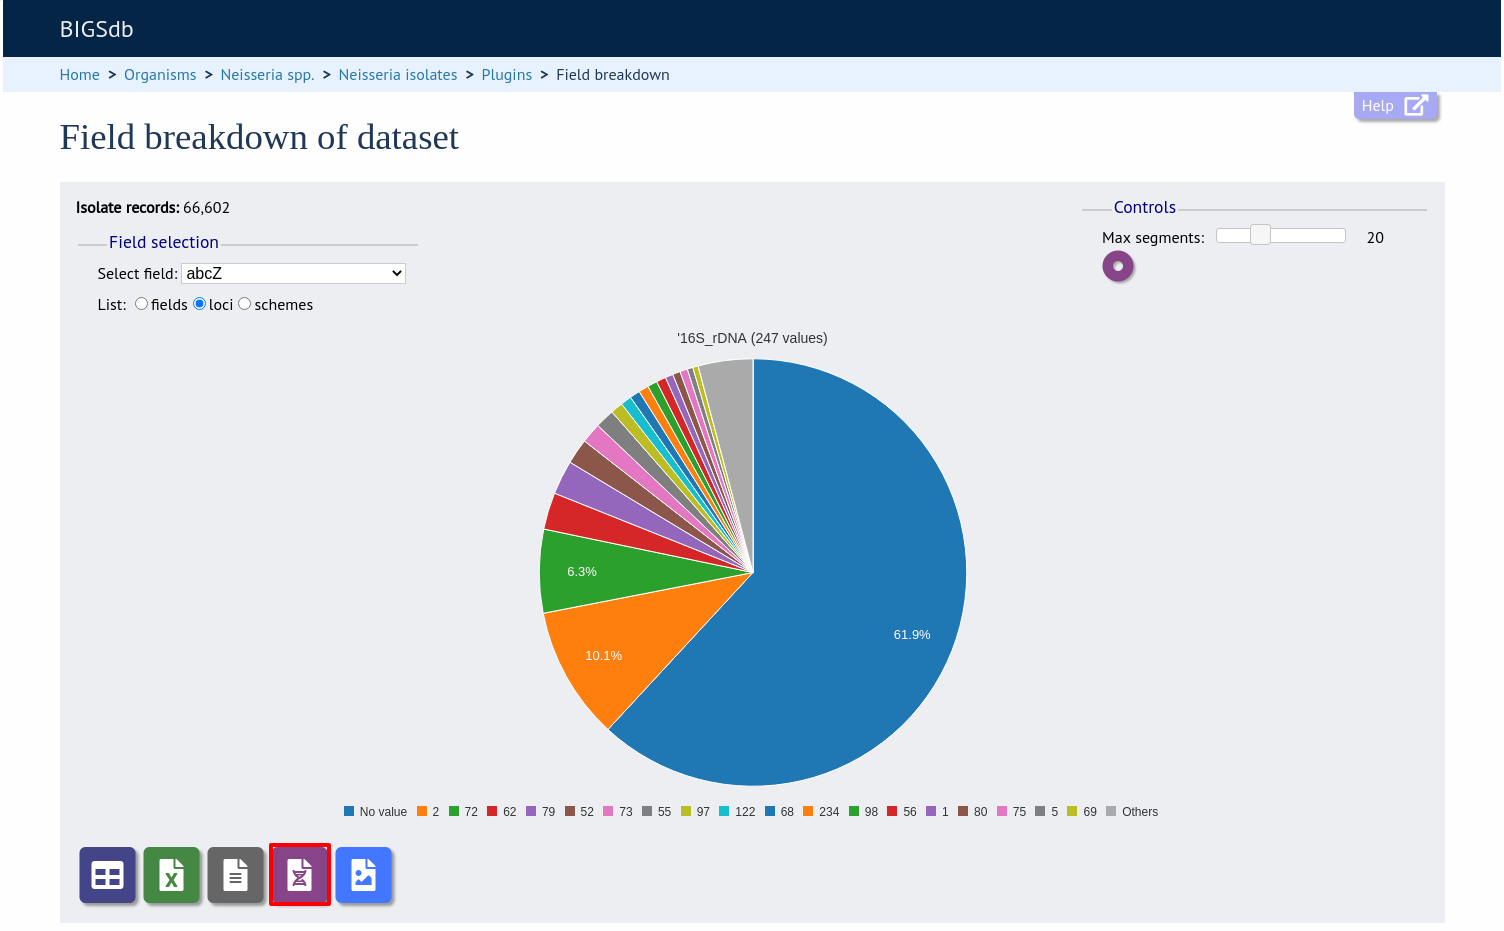
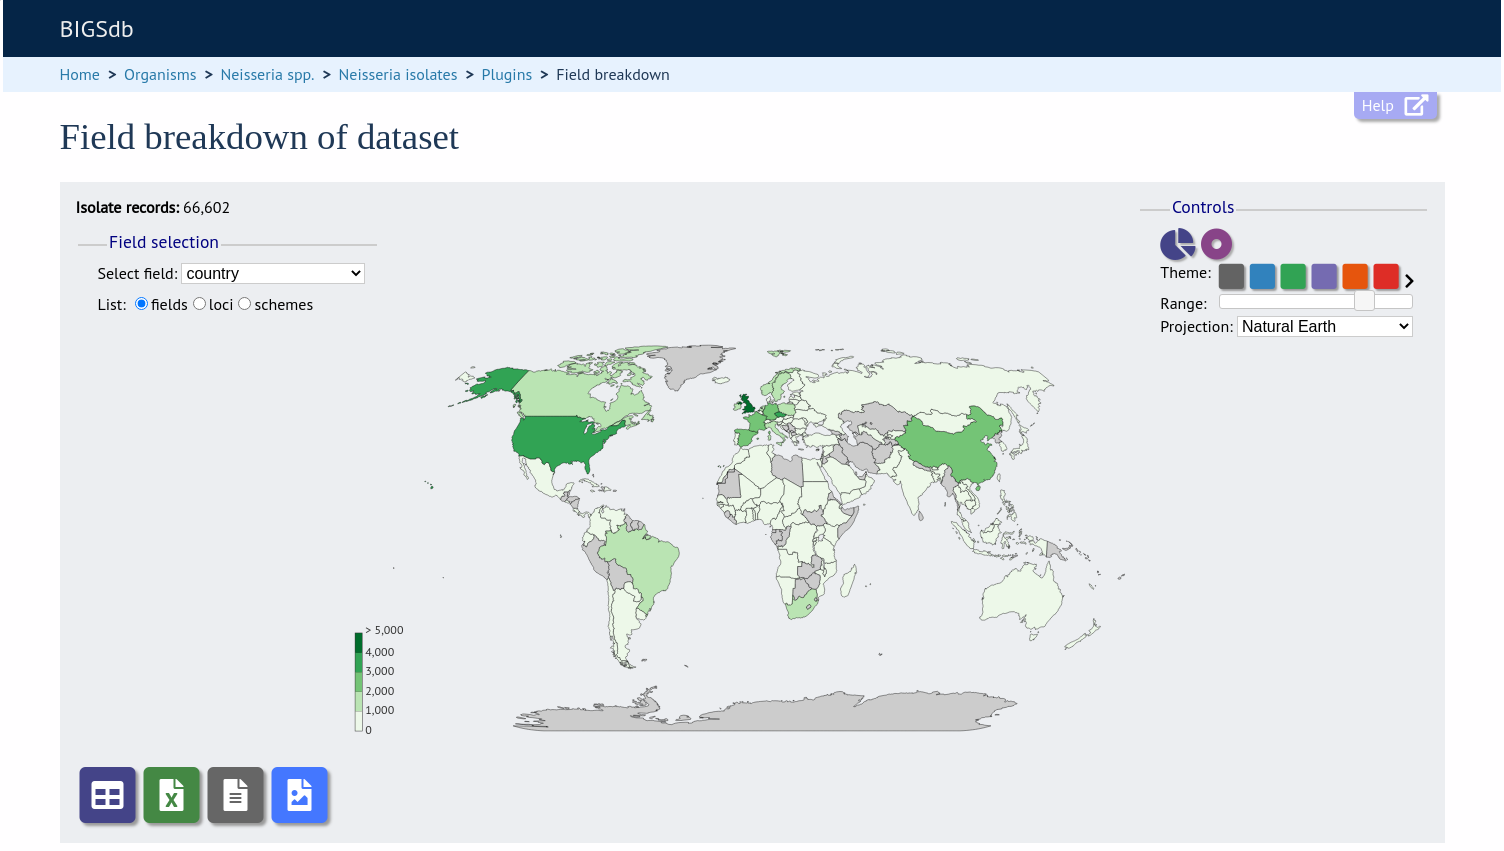
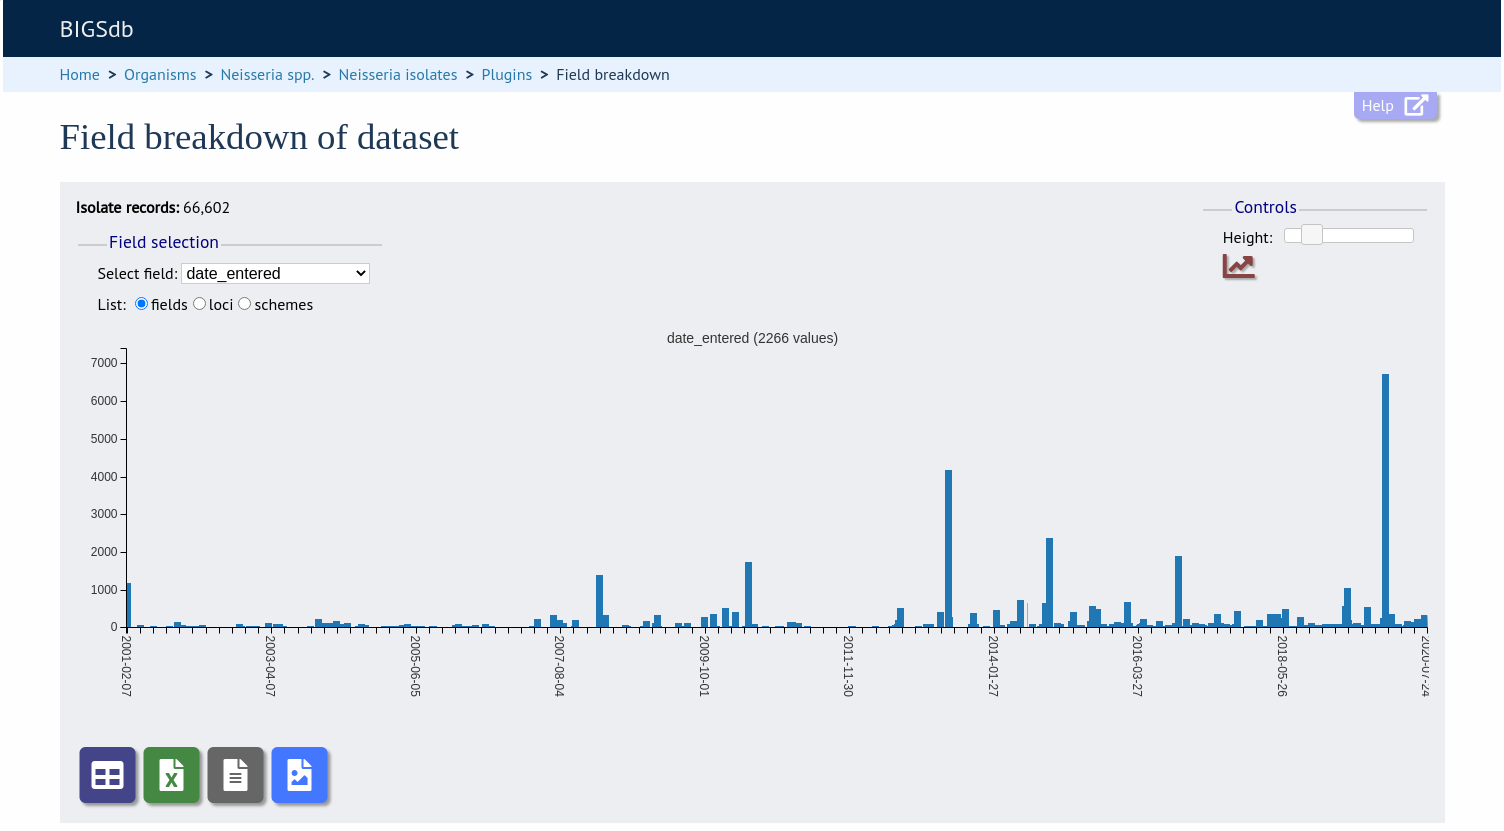
A chart will be displayed for the first field. Depending on the field type, this may be either a world map (for country or continent fields), pie chart, or bar chart.
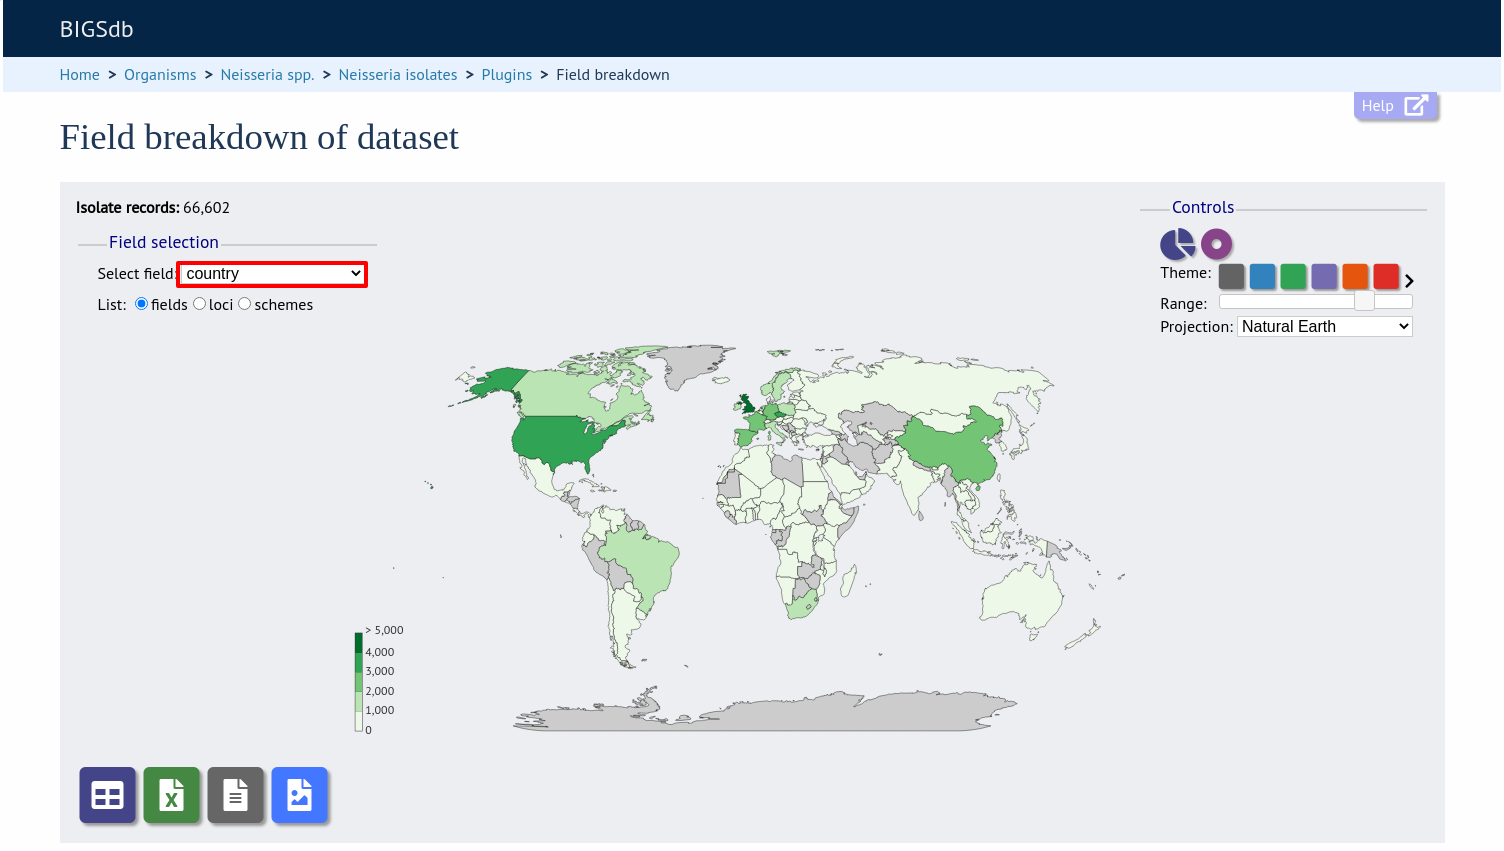
Other fields can be chosen by selecting them in the dropdown list box.
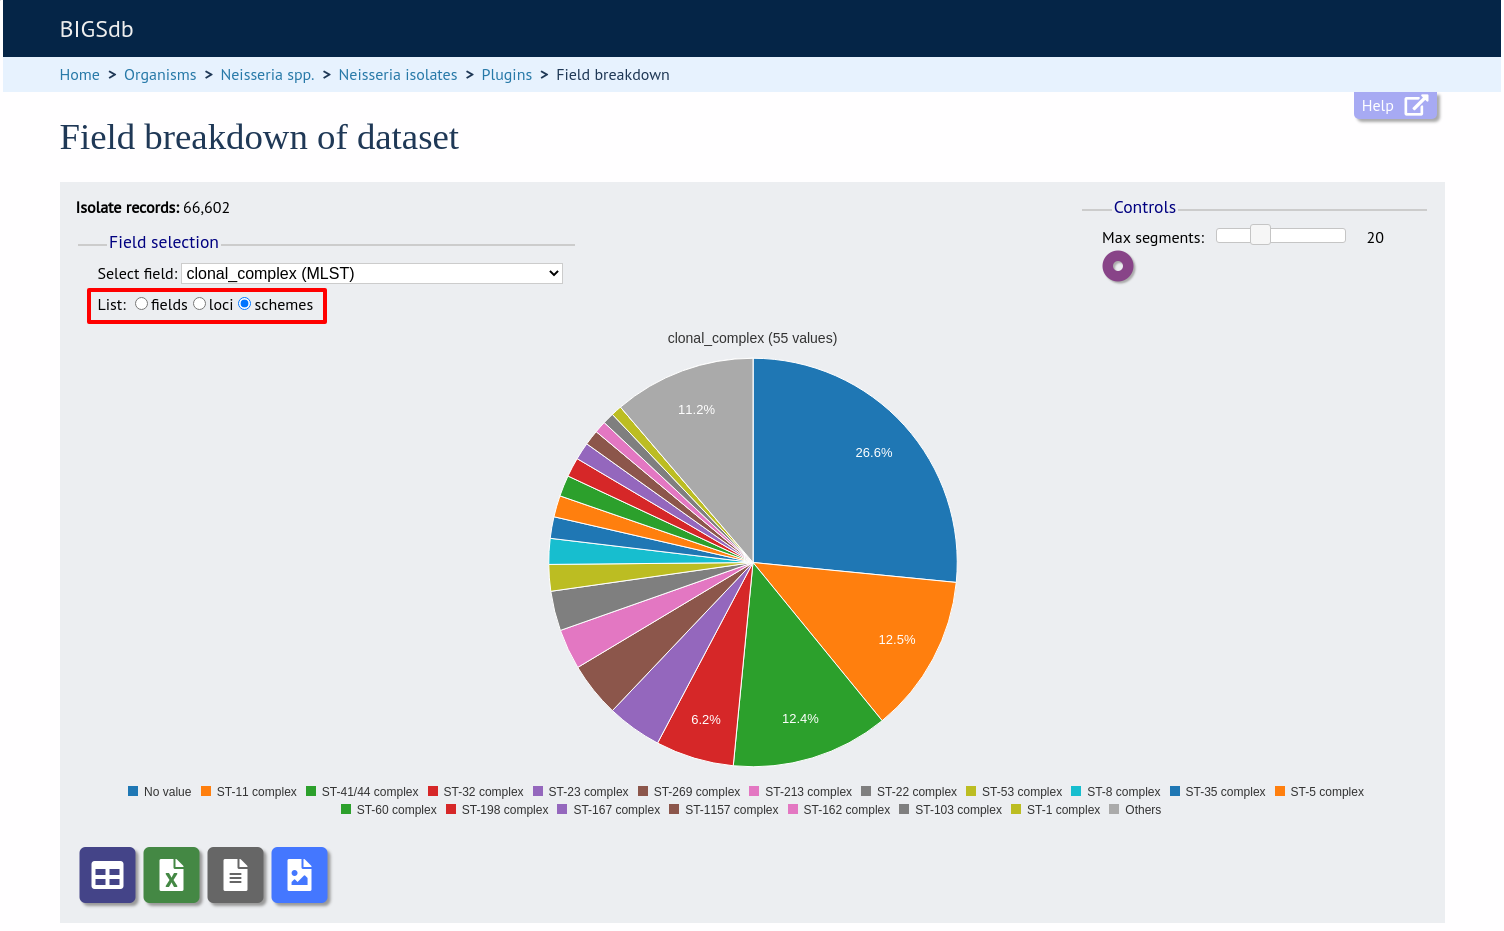
You can also breakdown loci and schemes by clicking the appropriate button. This will re-populate the dropdown list.
The charts are dynamic and you can manipulate some aspects of them using controls shown on the screen.
Maps
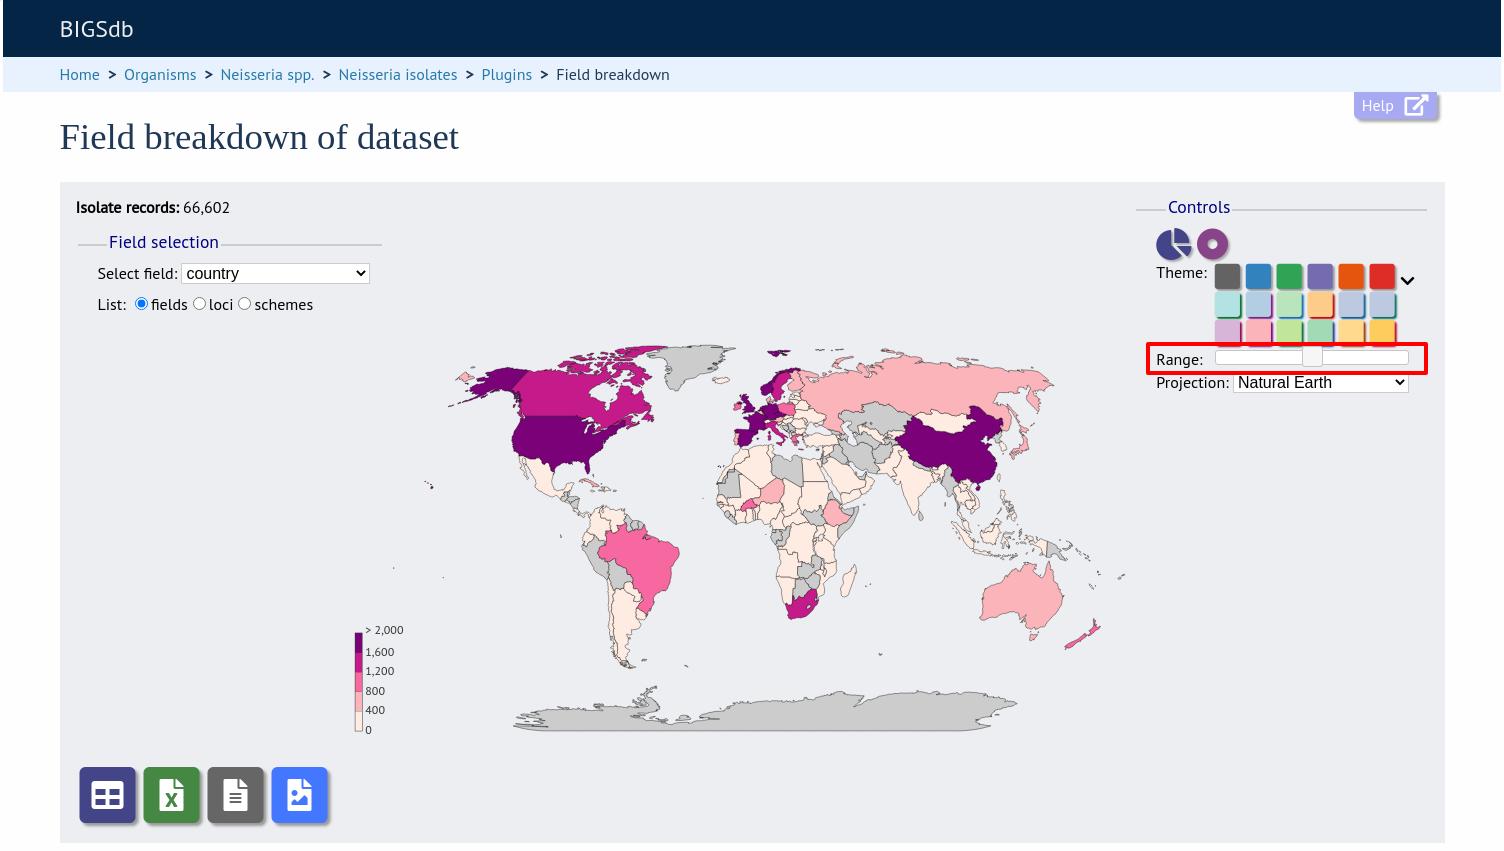
World maps are shown for country and continent fields (provided standardized country names are used in the database). The maps can be modified in a number of ways.
The colour theme can be changed by clicked the appropriate coloured square. Additional themes are available by clicking the ‘>’ link.
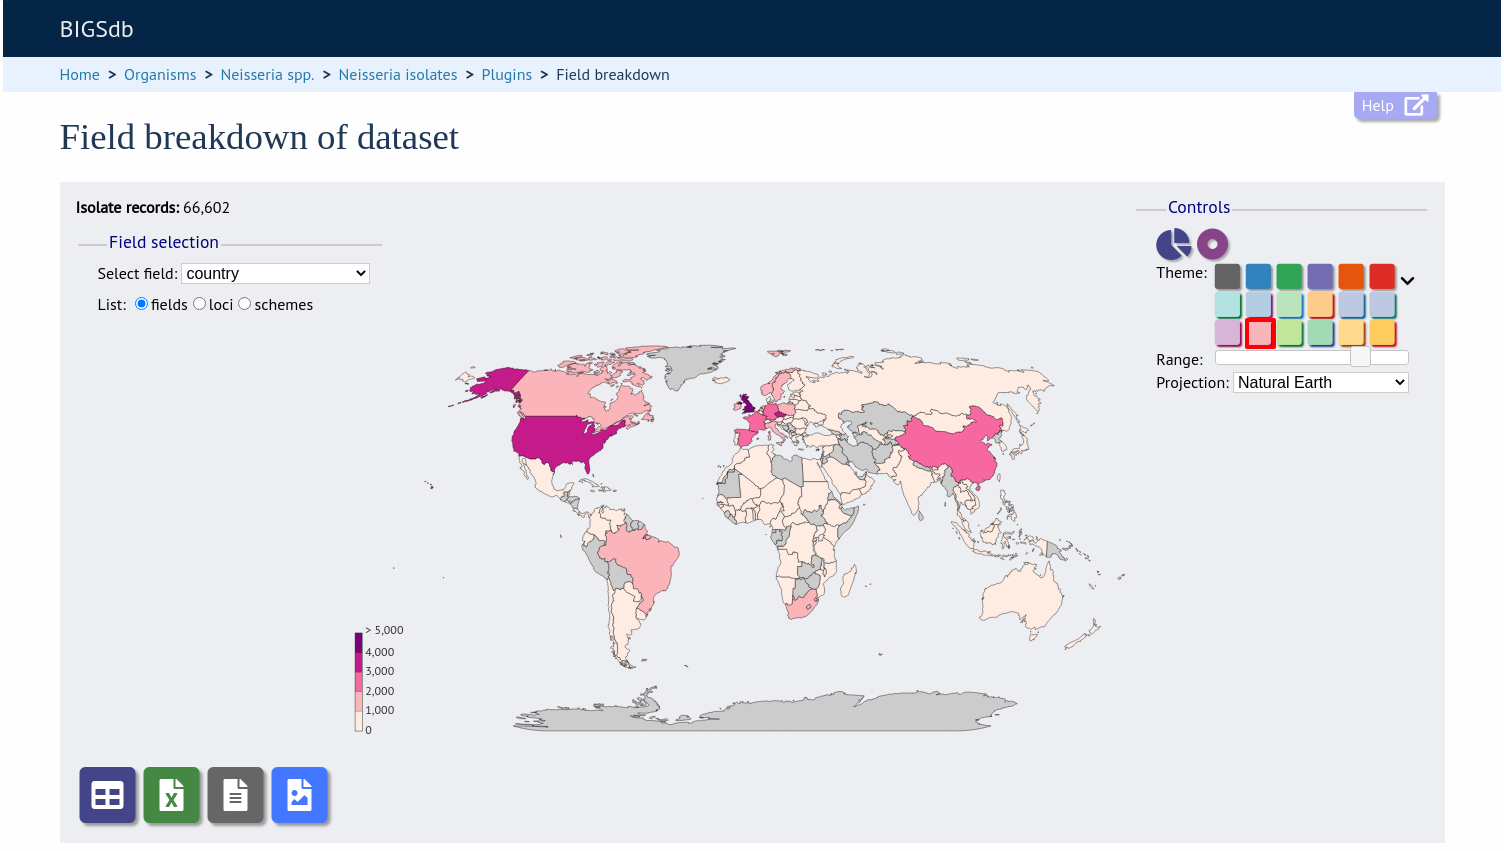
The range that is used to decide the colour boundaries can be changed by using the range slider.
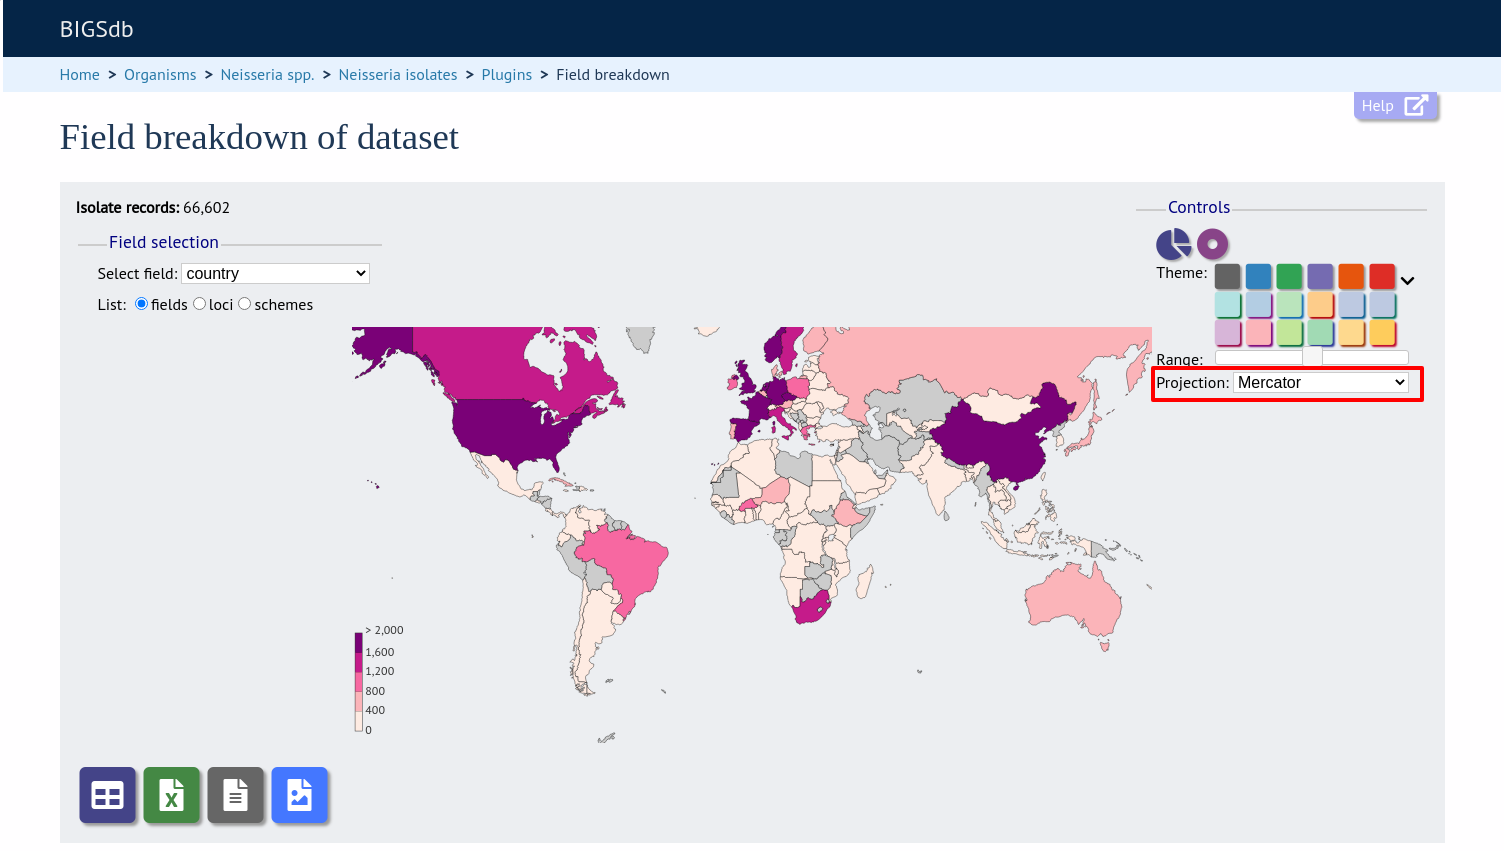
Finally the map projection can be changed. The default ‘Natural Earth’ provides a reasonable display for most latitudes but you may prefer others such as ‘Mercator’.
To see the same data as a pie chart, click the ‘Pie’ or ‘Donut’ icons.
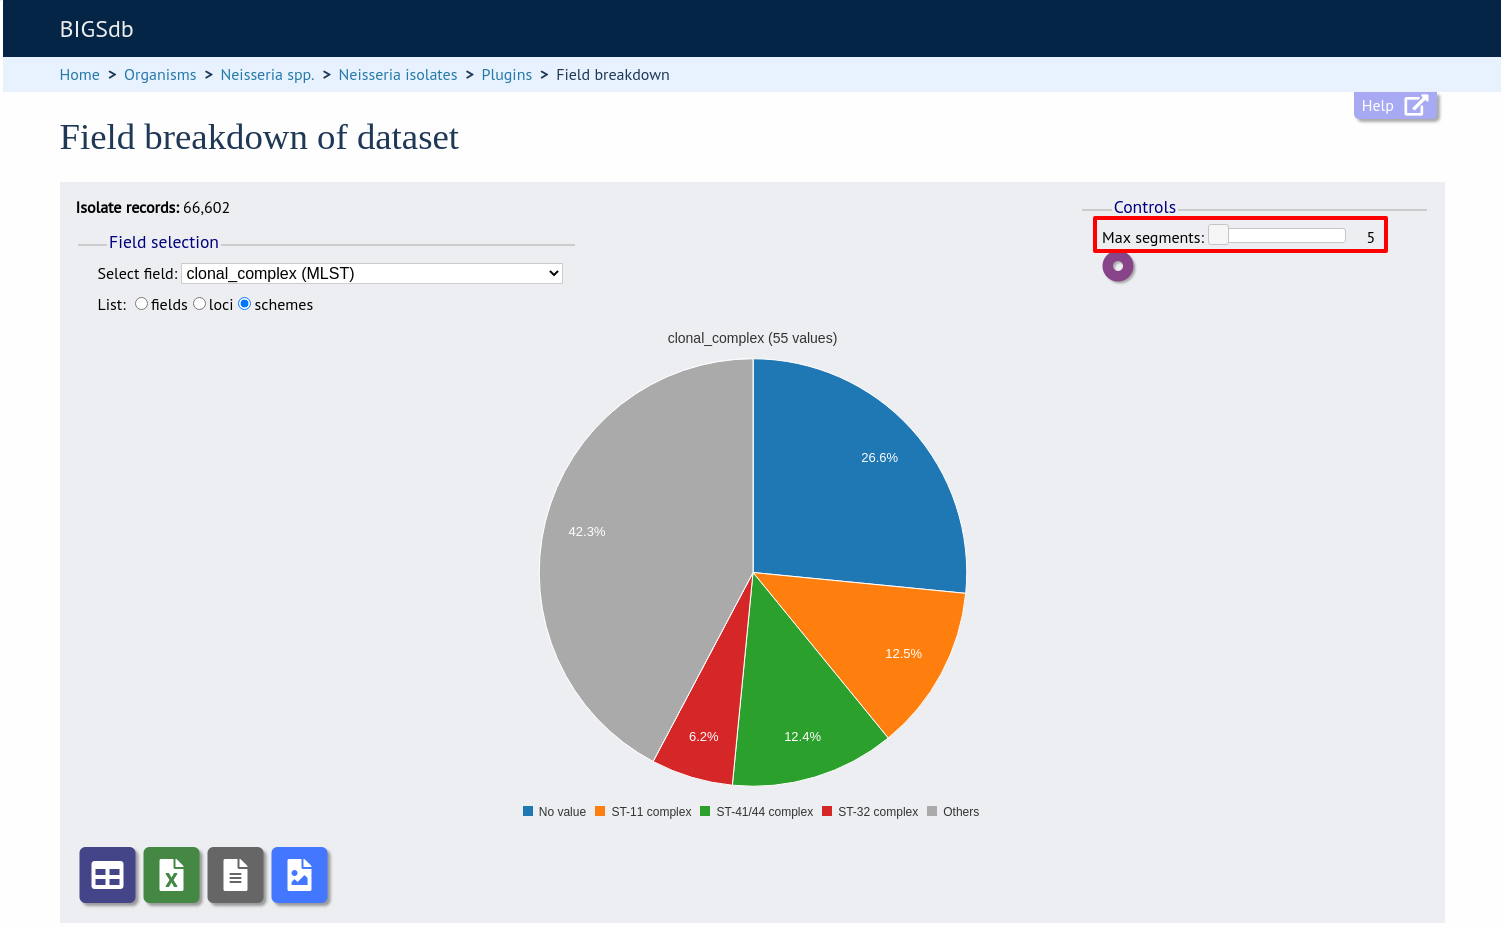
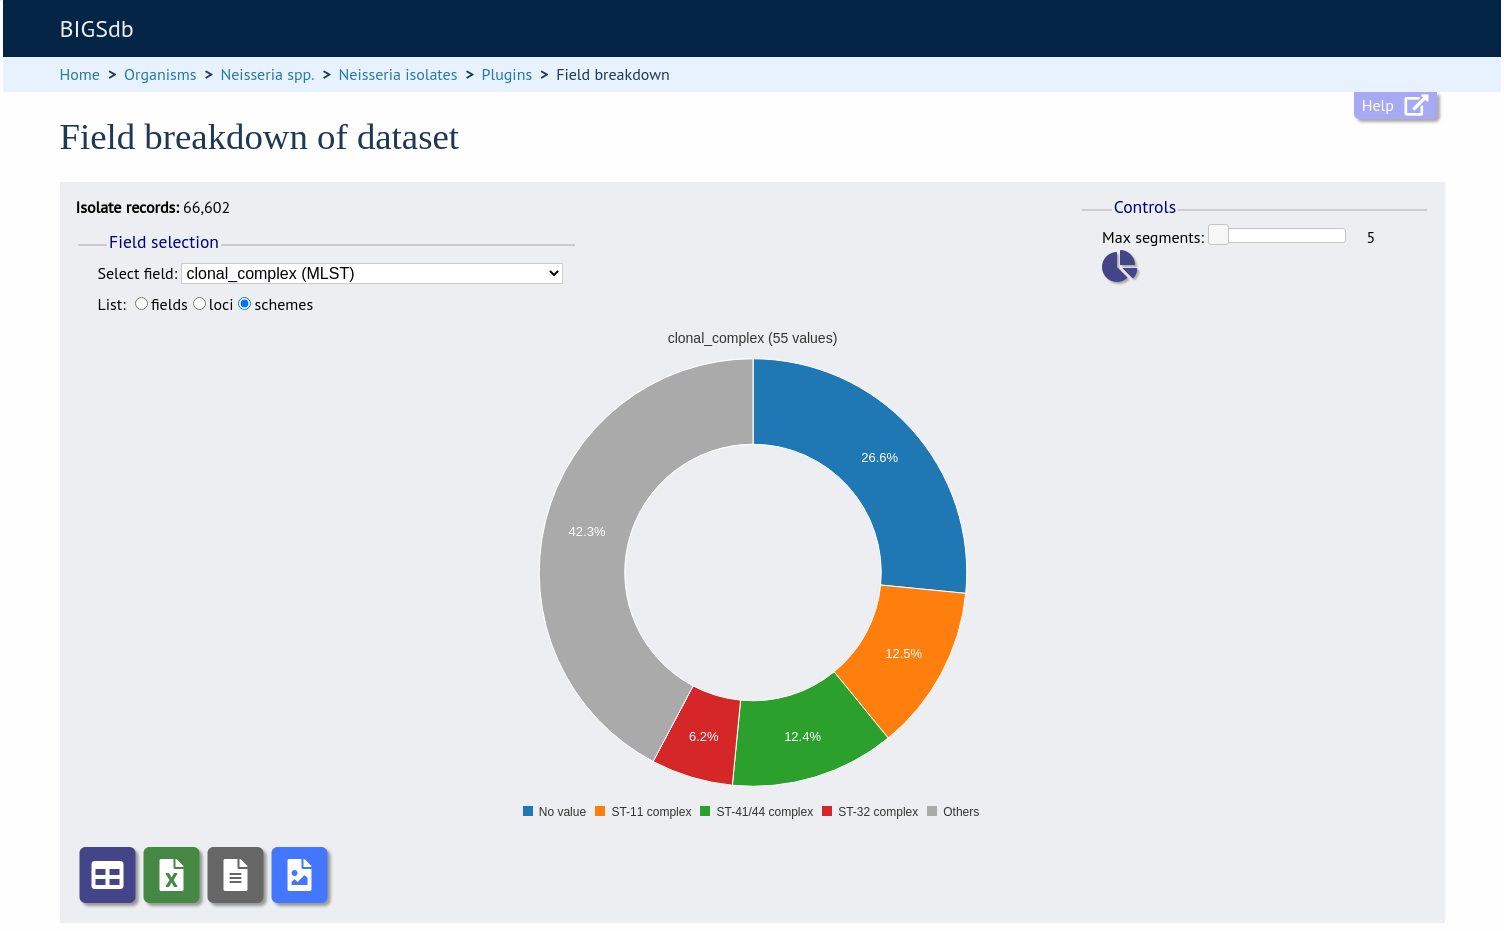
Pie charts
The maximum number of segments shown can be modified by sliding the ‘Max segments’ control. Low frequency values will be grouped in to a segment called ‘Others’.
The chart can be transformed in to a donut chart by clicking the donut icon.
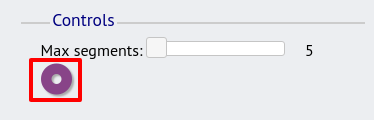
The icon changes to a pie chart image (clicking this will return to the pie chart).
Values can also be removed from the analysis by clicking their label in the legend below the chart. The percentages of the other values will be recalculated. Clicking the label again will re-add the value.
Bar charts
Integer fields will be displayed as a bar chart.
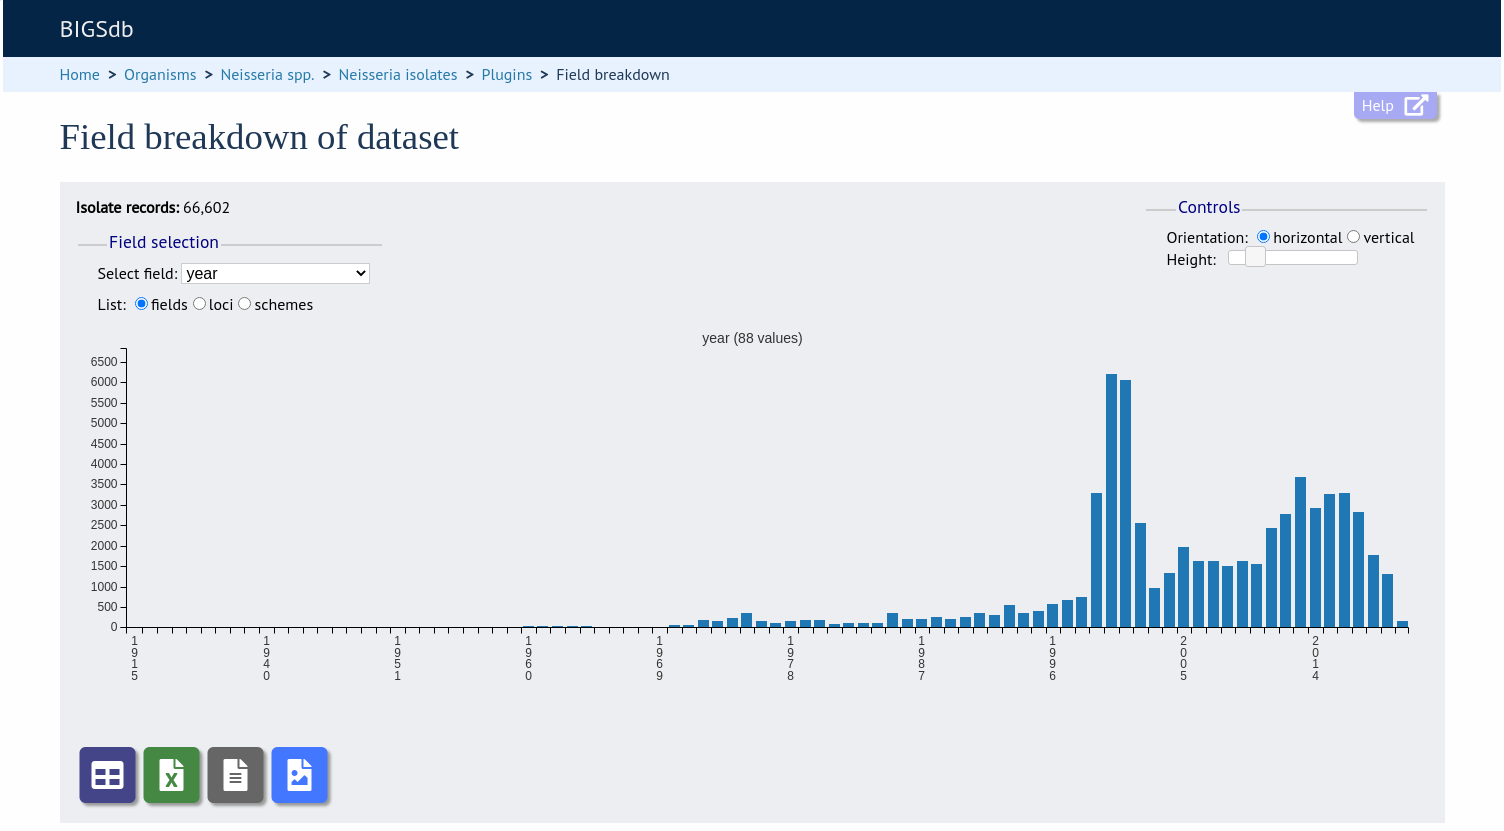
You can modify the height and the orientation of the chart using the controls.
Line charts
Date fields will be displayed as a line chart. By default this shows the cumulative values.
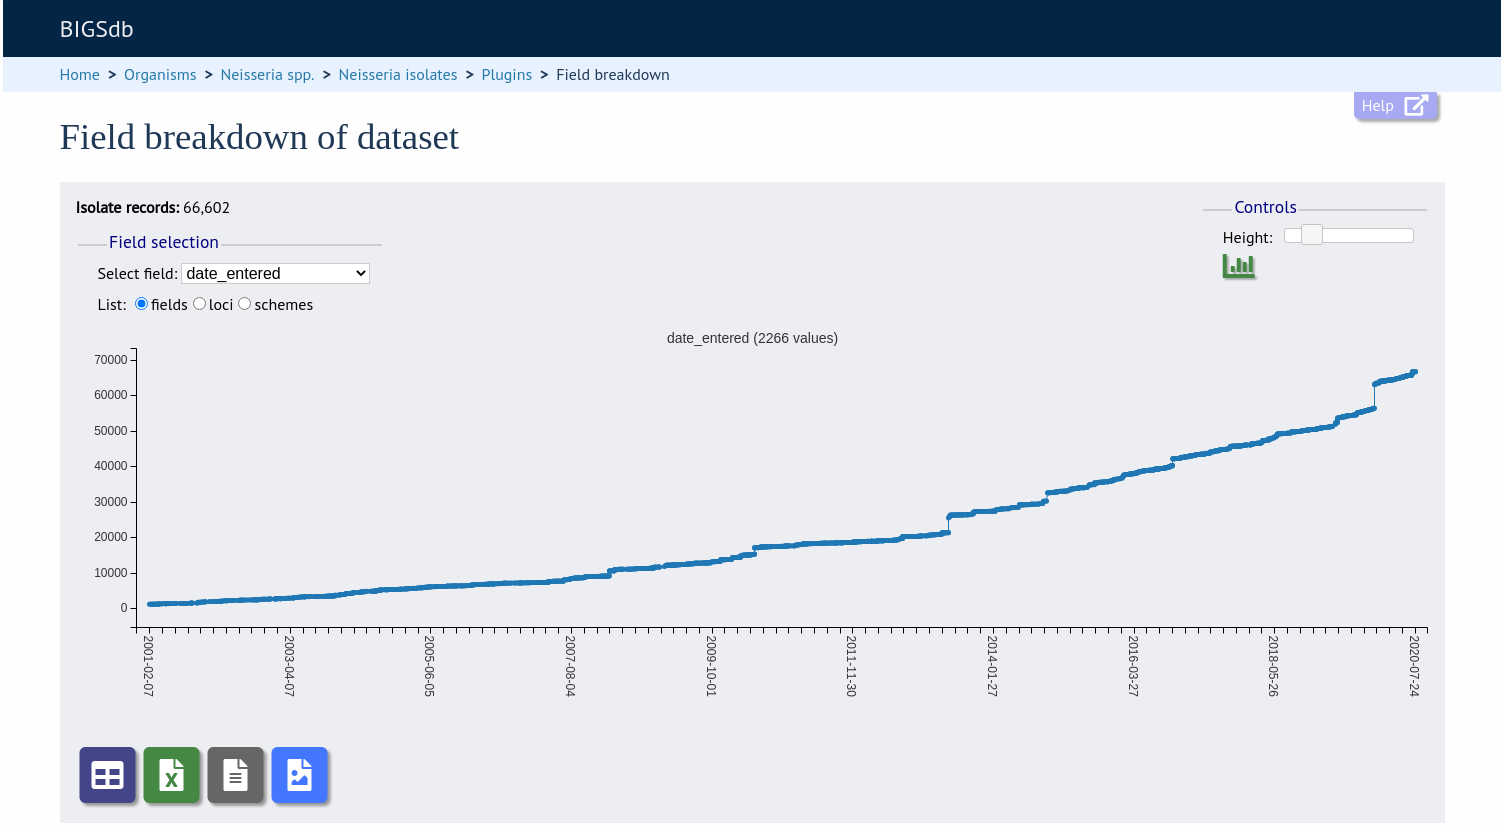
The chart can be converted in to a bar chart showing discrete values by clicking the bar chart icon.
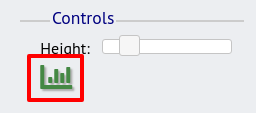
The icon changes to a line chart image (clicking this will return to the line chart).
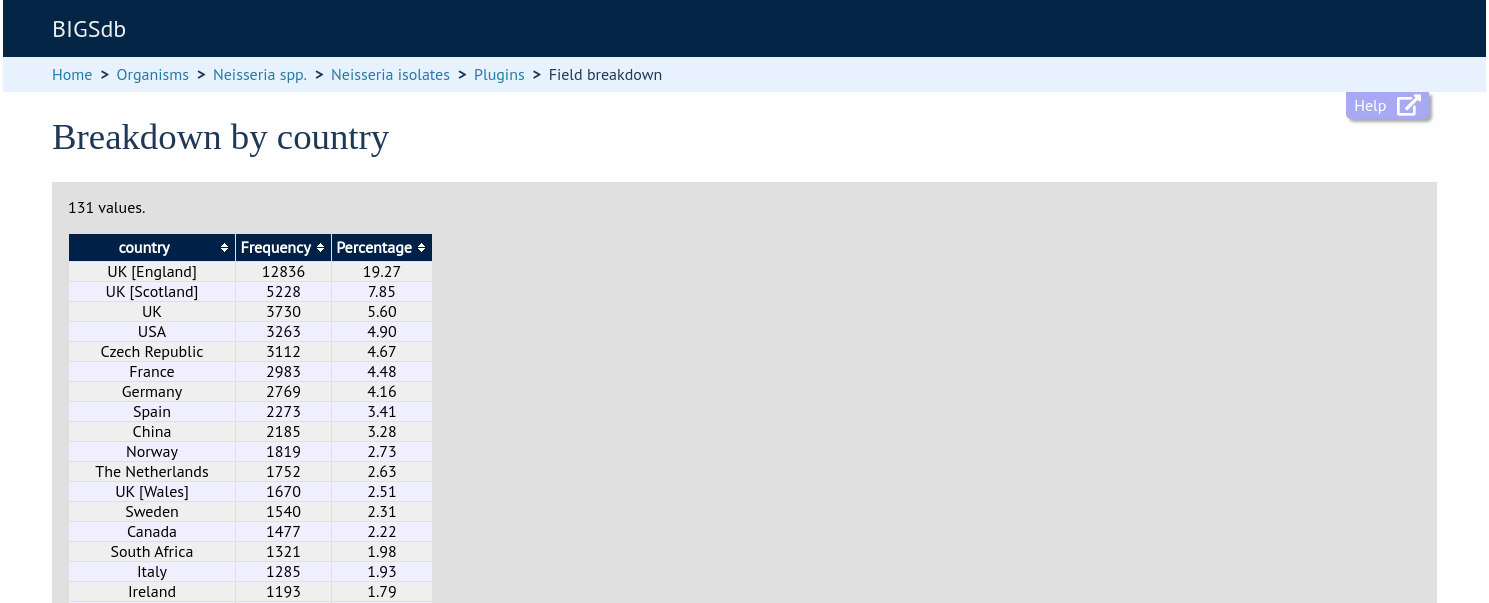
Summary tables
The field breakdown can be displayed as a summary table containing values and percentages of all values. This can be selected by clicking the table icon below the displayed chart.

The table can be re-ordered by clicking any of the headings.
The same table can be exported as an Excel file by clicking the Excel icon.

Alternatively, it can be exported as a tab-delimited text file by clicking the text file icon.

The chart image can also be saved as a SVG file, suitable for manipulation in a graphics program.

Exporting allele sequences
If a locus breakdown is being display, you can choose to export the allele sequences in FASTA format by clicking the FASTA file icon.