Two field breakdown
The two field breakdown plugin displays a table breaking down one field against another, e.g. breakdown of serogroup by year.
The analysis can be accessed by selecting the ‘Analysis’ section on the main contents page.
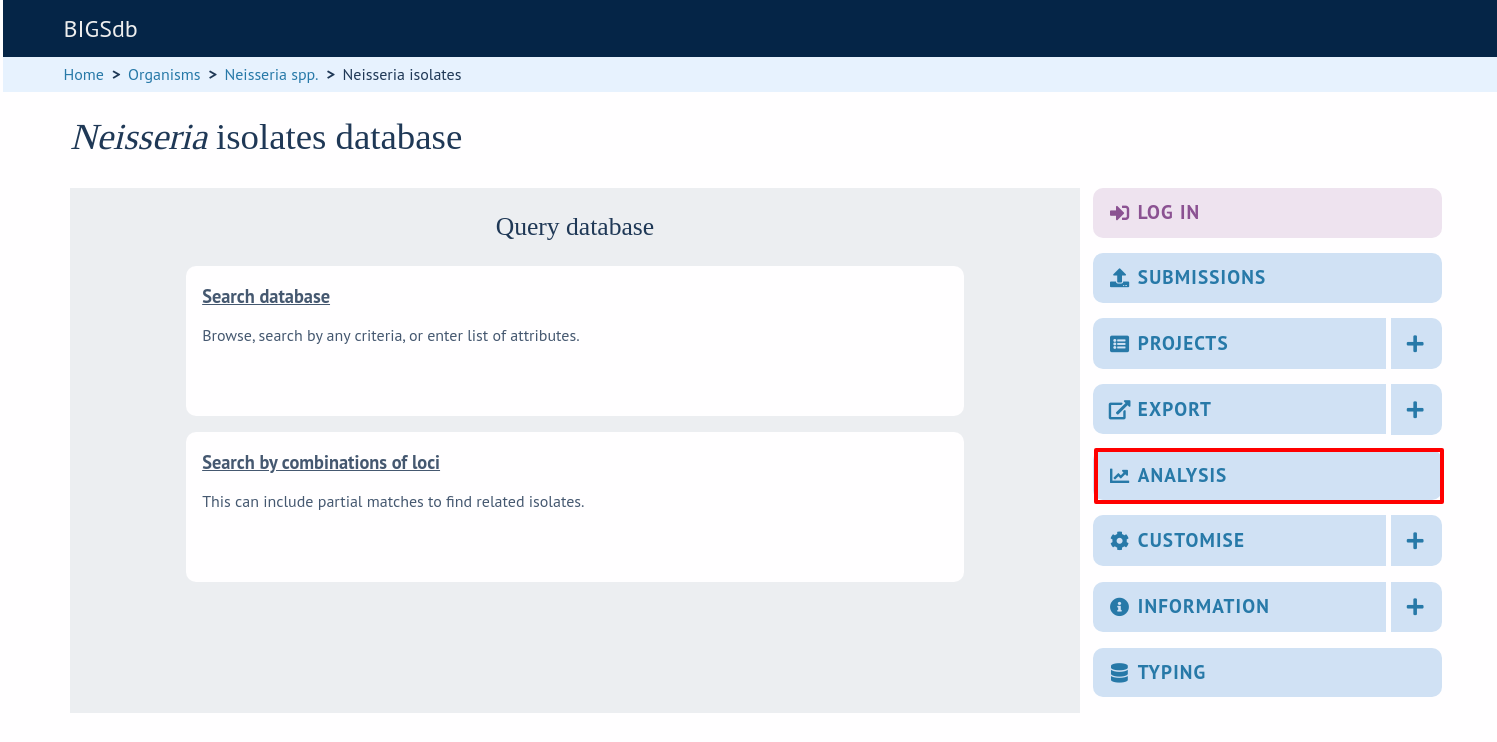
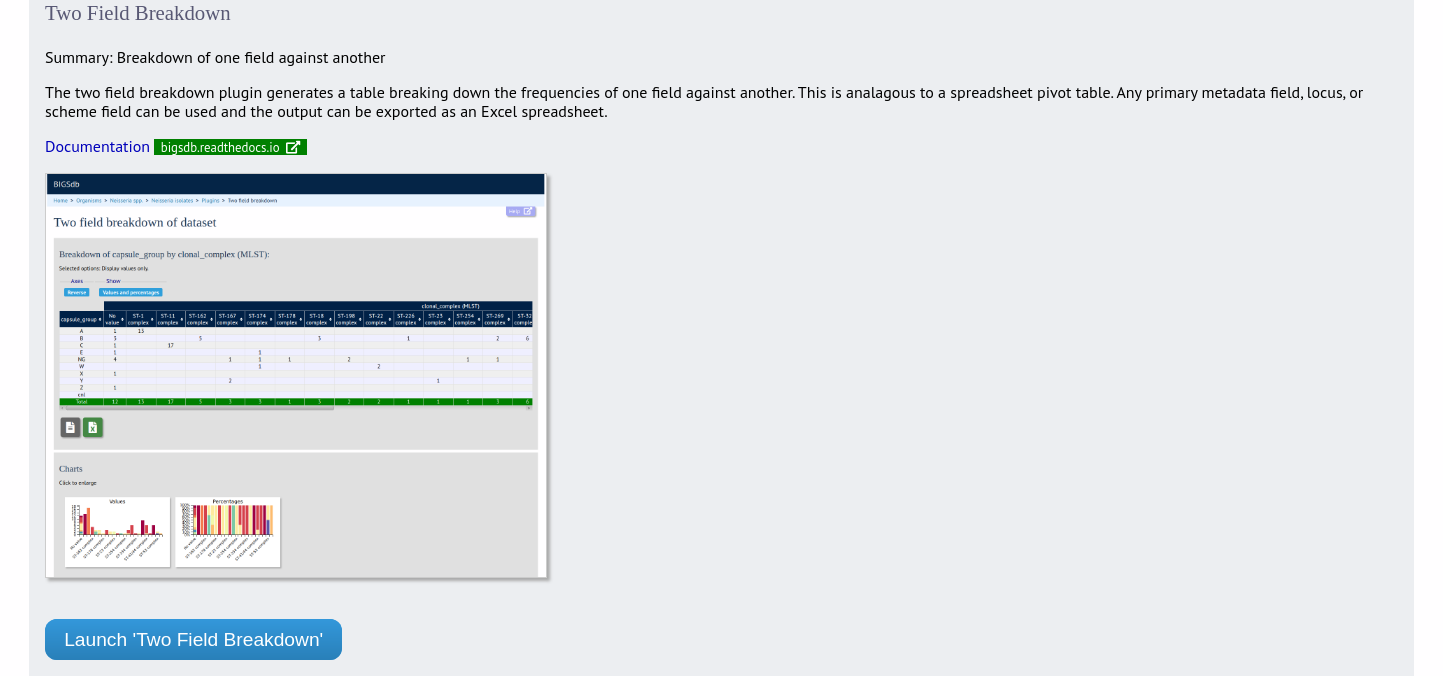
Jump to the ‘Breakdown’ category, follow the link to Two Field Breakdown, then click ‘Launch Two Field Breakdown’.
The analysis can be selected for the whole database by clicking the ‘Two field breakdown’ link on the main contents page.
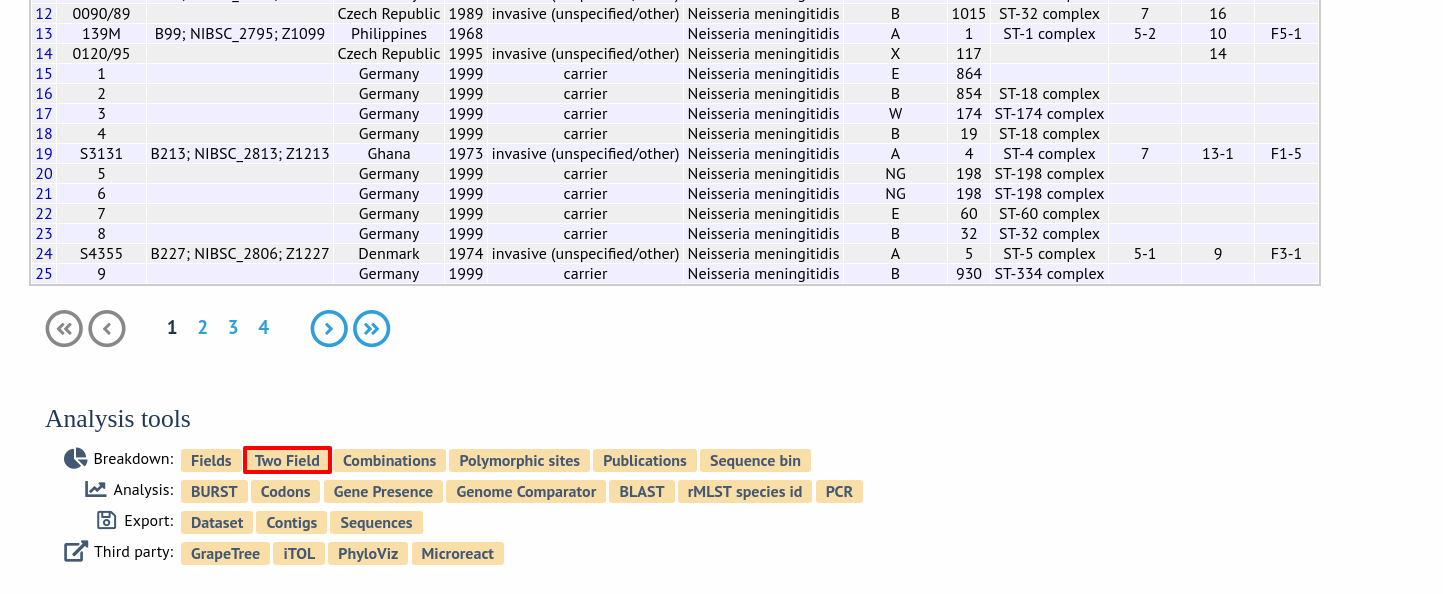
Alternatively, a two field breakdown can be displayed of the dataset returned from a query by clicking the ‘Two field’ button in the Breakdown list at the bottom of the results table. Please note that the list of functions here may vary depending on the setup of the database.
Select the two fields you wish to breakdown and how you would like the values displayed (percentage/absolute values and totaling options).
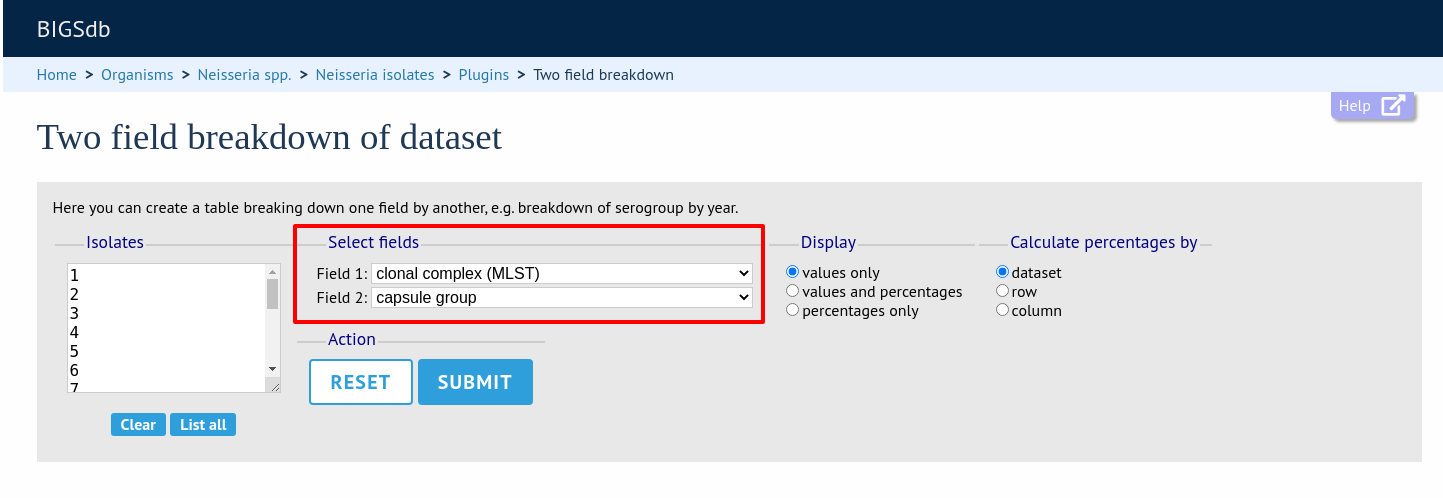
Click submit. The breakdown will be displayed as a table. Bar charts will also be displayed provided the number of returned values for both fields are fewer than 30.
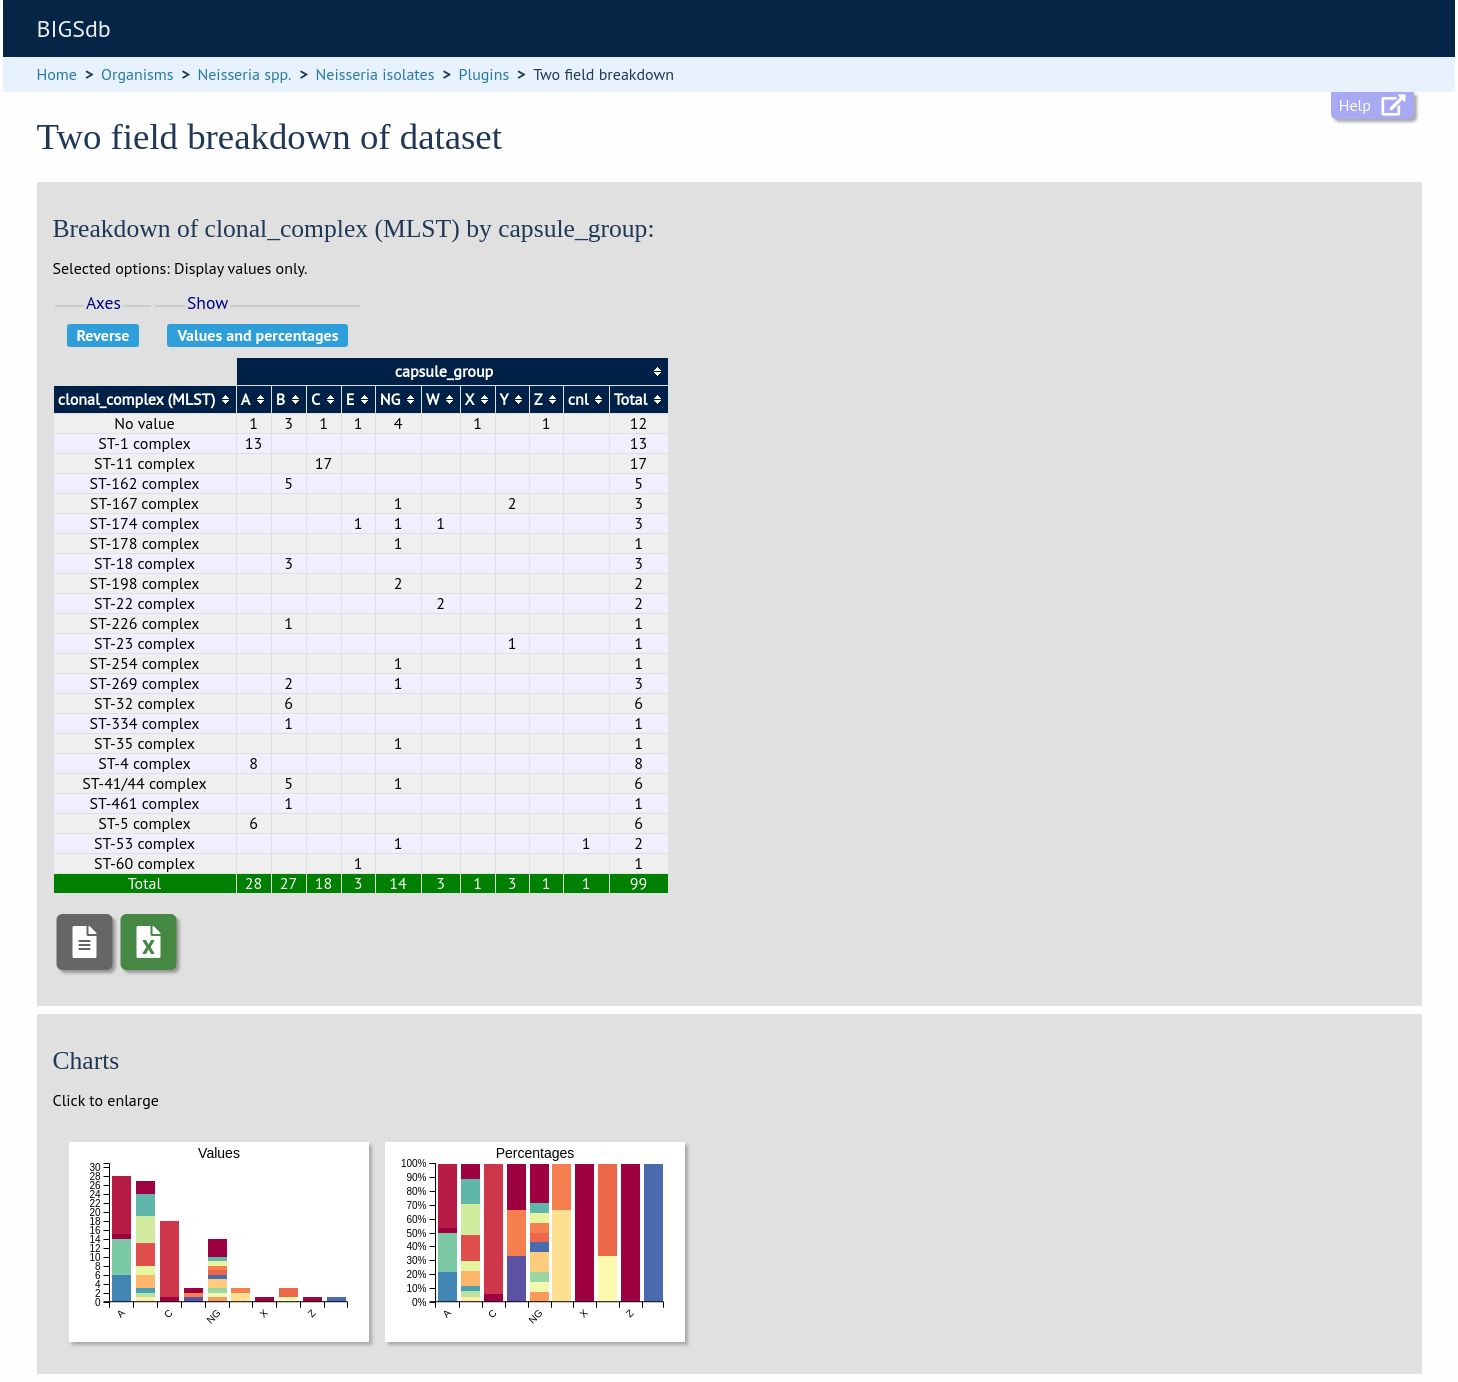
The table values can be exported in a format suitable for copying in to a spreadsheet by clicking ‘Download as tab-delimited text’ underneath the table.
Note
The job will be submitted to the offline job queue if the query returns 10,000 or more isolates. In this case, the buttons to reverse the axes or to change whether values or percentages are shown will not be available.