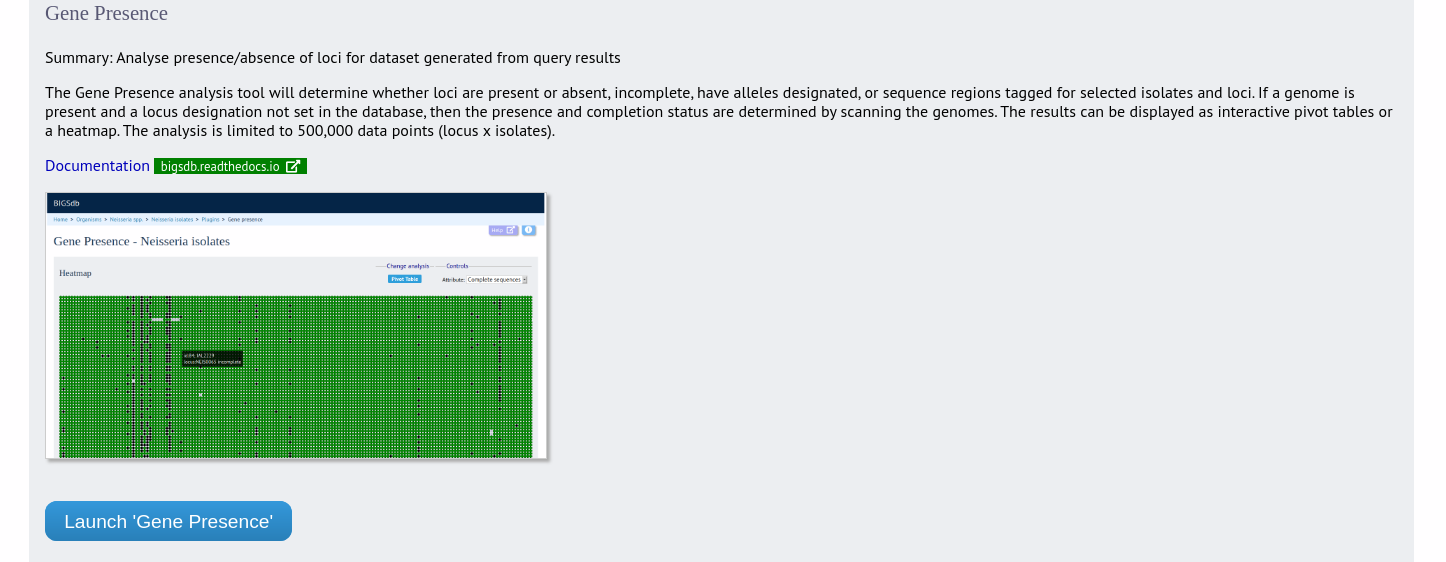
Gene Presence
The Gene Presence analysis tool will determine whether loci are present or absent, incomplete, have alleles designated, or sequence regions tagged for selected isolates and loci. If a genome is present and a locus designation not set in the database, then the presence and completion status are determined by scanning the genomes. The results can be displayed as interactive pivot tables or a heatmap. The analysis is limited to 500,000 data points (locus x isolates).
The function can be accessed by selecting the ‘Analysis’ section on the main contents page.
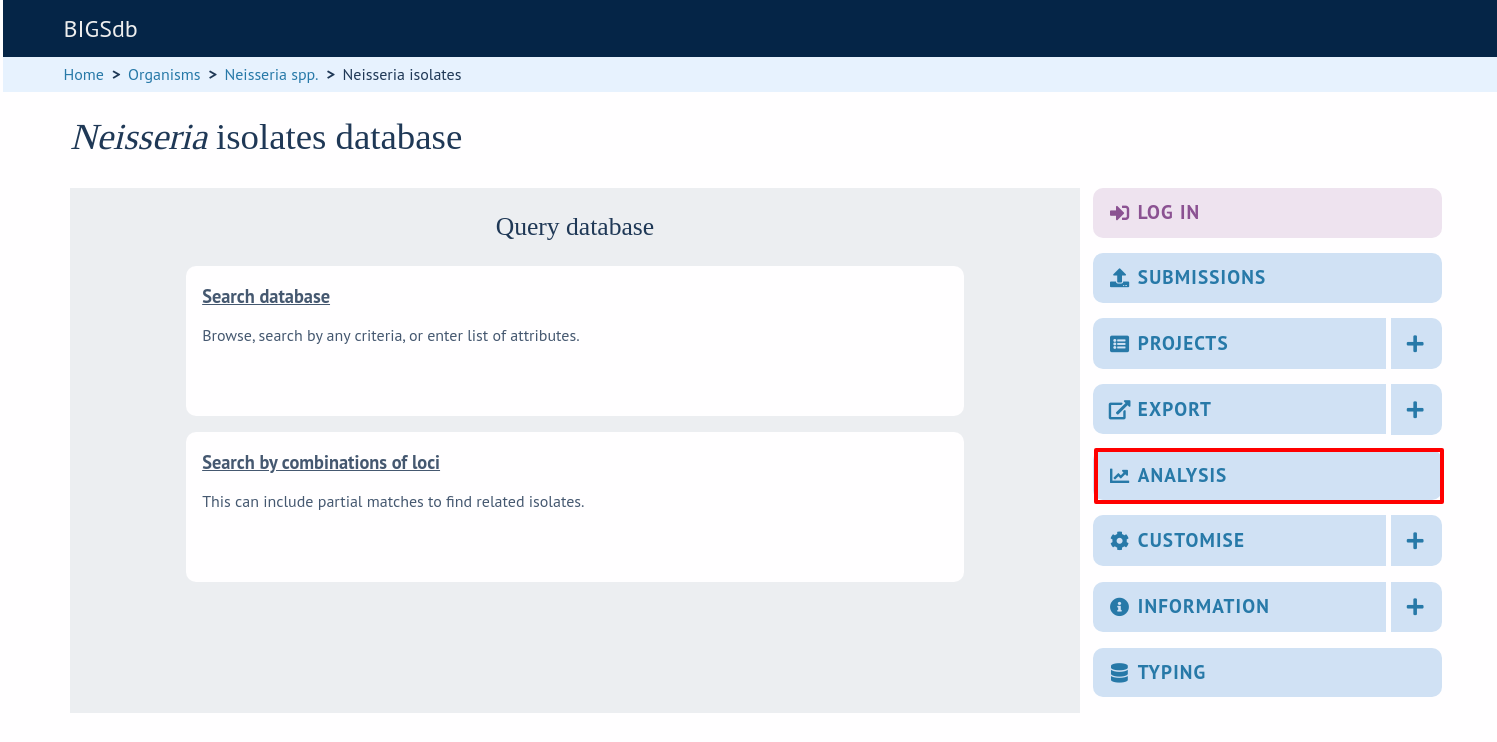
Jump to the ‘Analysis’ category, follow the link to ‘Gene Presence’, then click ‘Launch Gene Presence’.
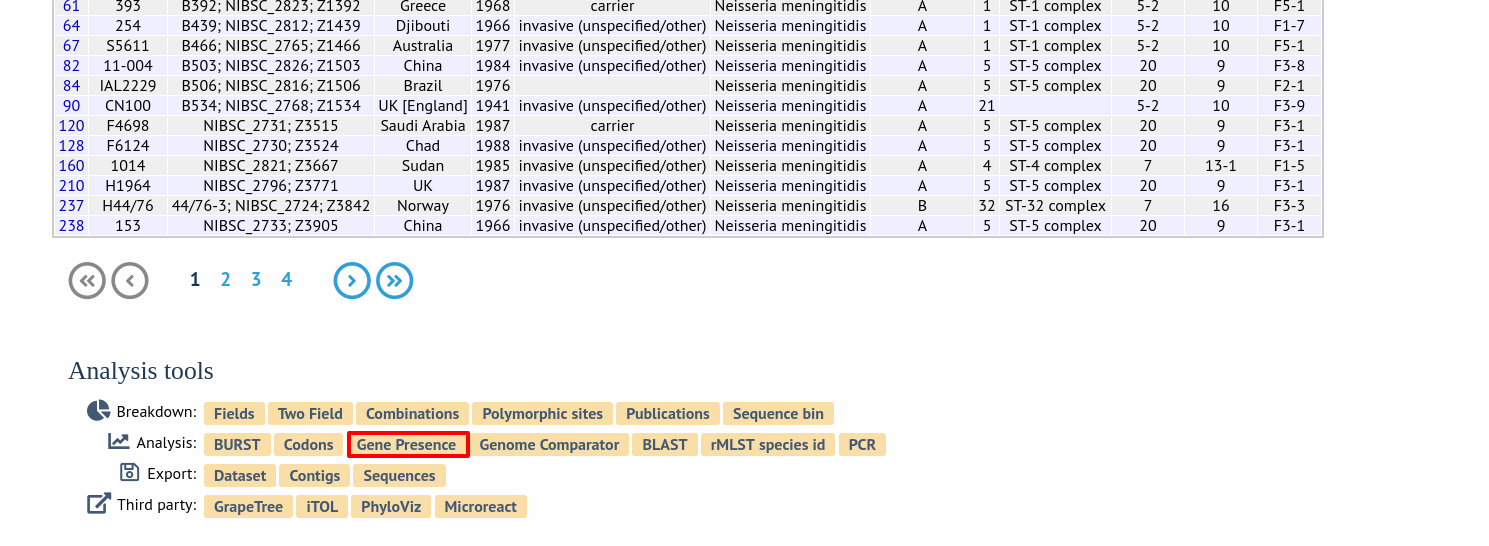
Alternatively, it can be accessed following a query by clicking the ‘Gene Presence’ button at the bottom of the results table. Isolates returned from the query will be automatically selected within the plugin interface.
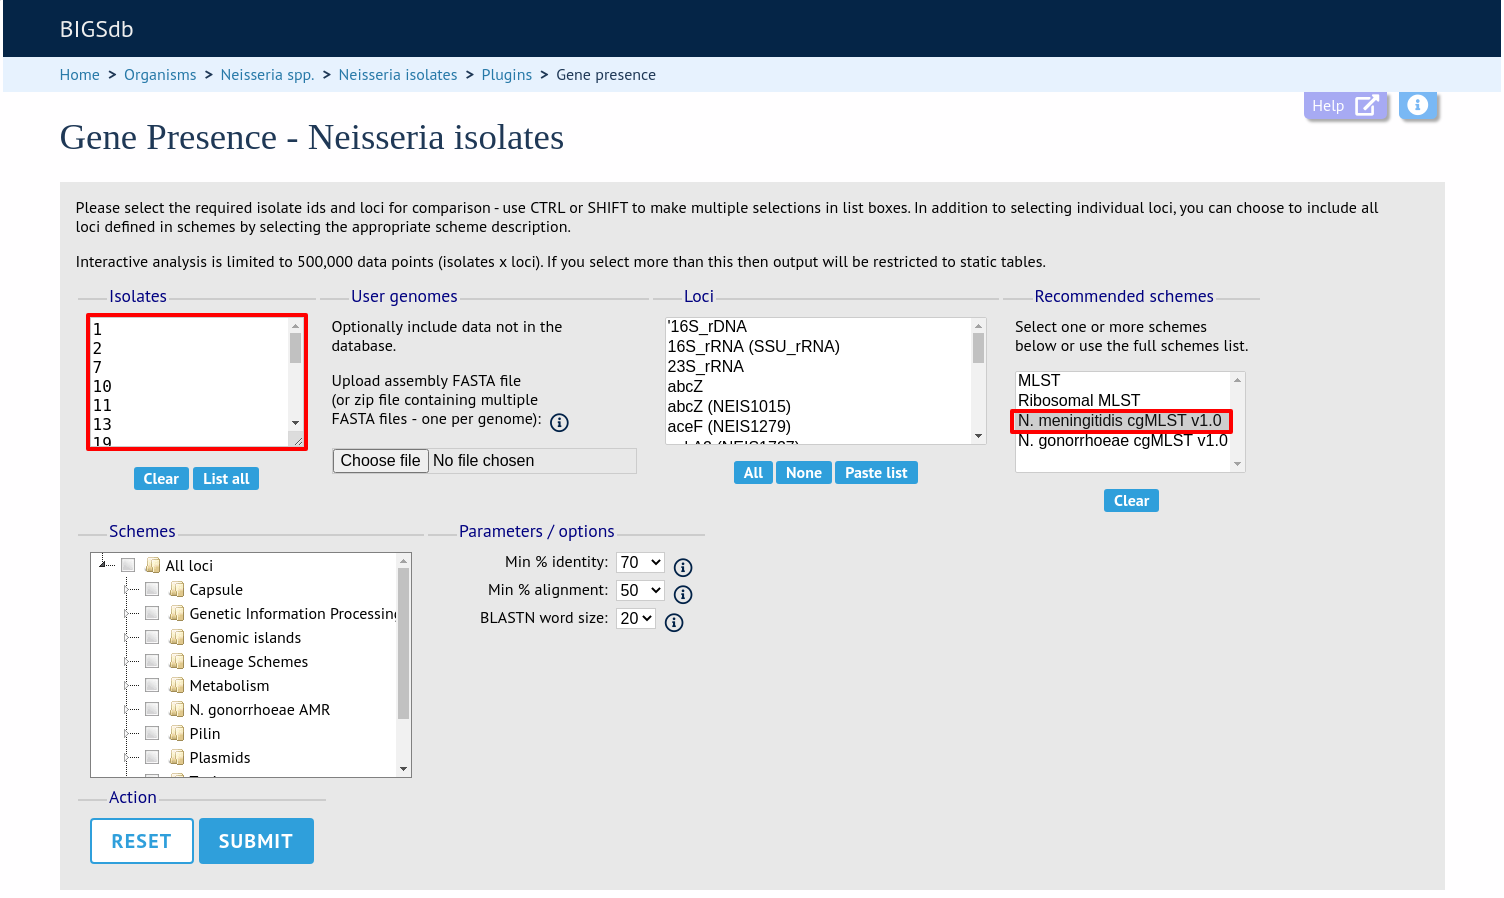
Select the isolates to include. Analysis can be performed on any selection of loci, or more conveniently, you can select a scheme in the scheme selector to include all loci belonging to that scheme. You can also select a recommended scheme if these have been defined.
The parameters of the BLAST query used to determine presence or absence can be modified, but in most cases the default options should work well. Click ‘Submit’ to start the analysis.
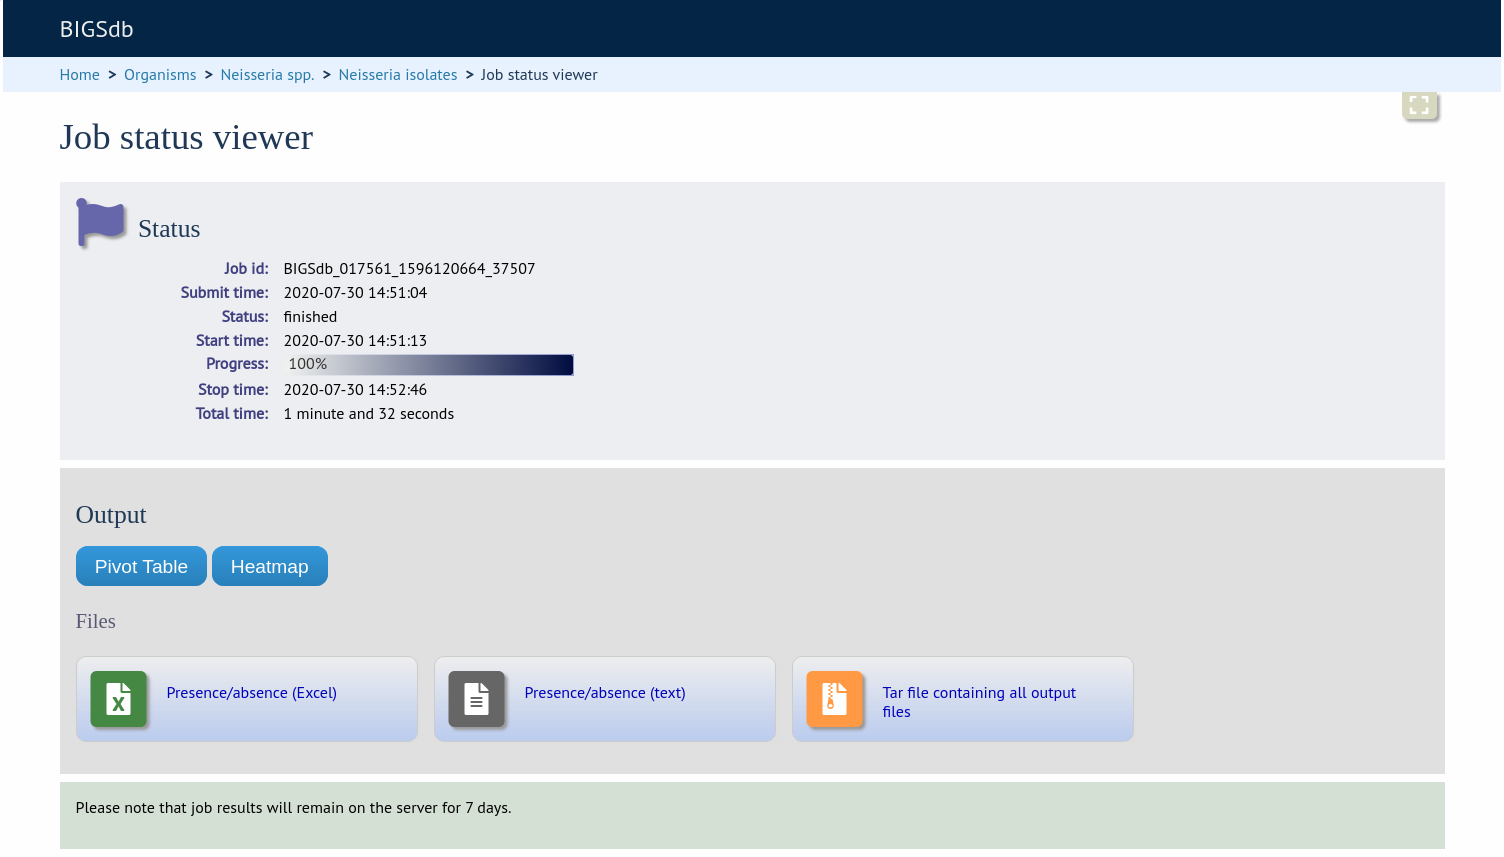
The job will be sent to the job queue. When it has finished, you will have two options to display the output: ‘Pivot Table’ or ‘Heatmap’.
Pivot Table
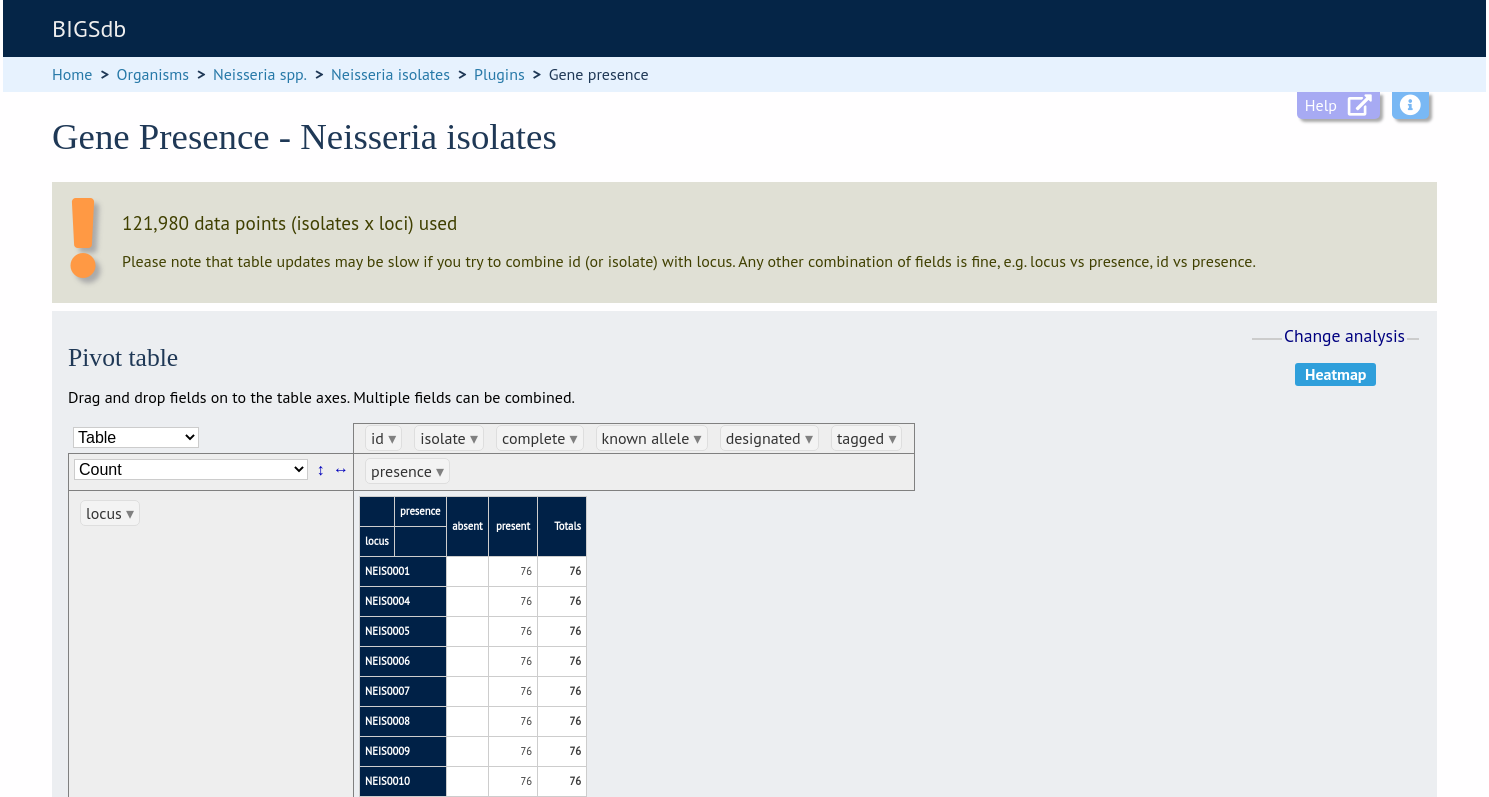
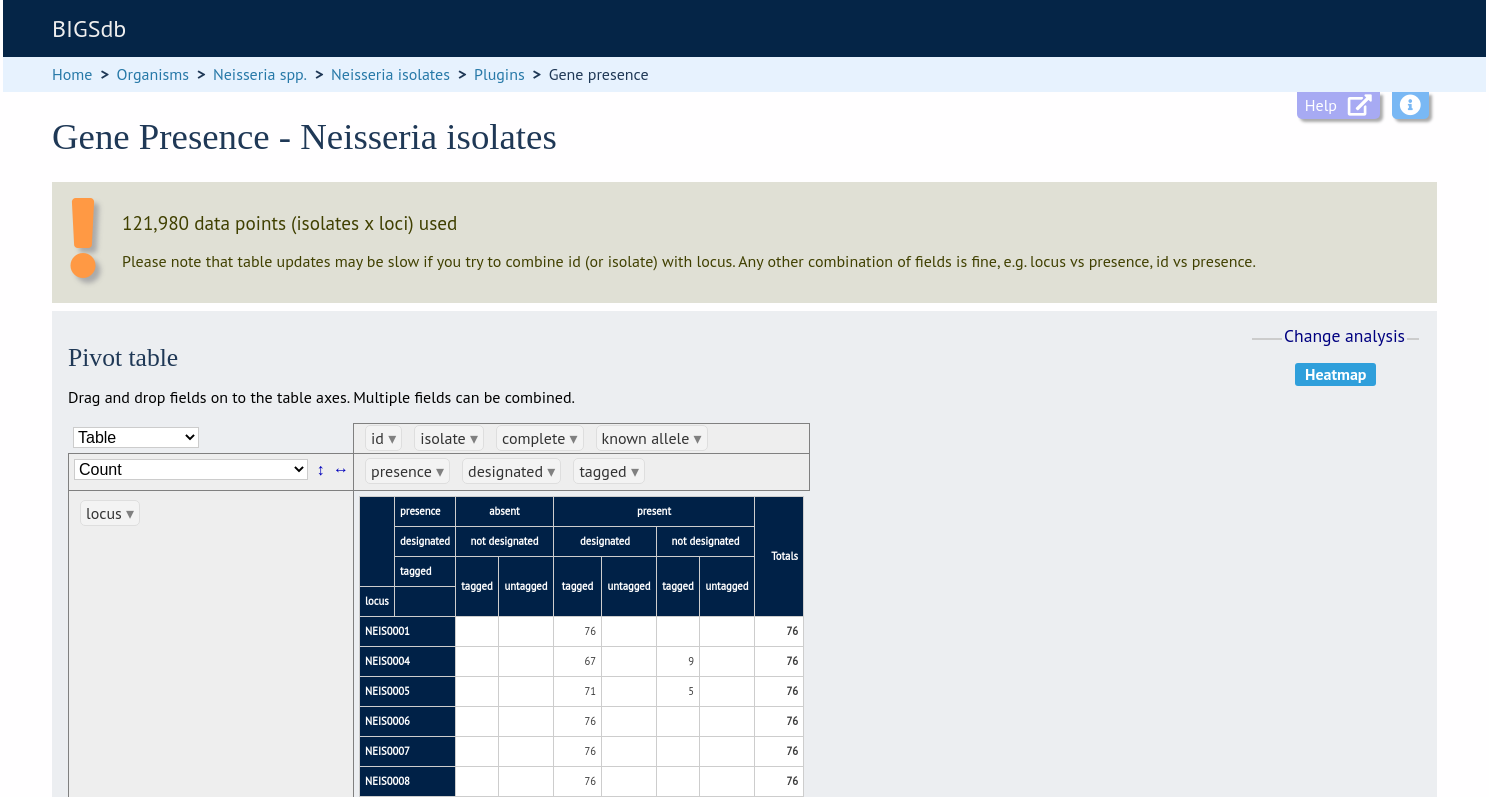
Clicking the ‘Pivot Table’ button will display an interactive pivot table. The default display shows the number of isolates for which each locus is present or absent.
You can break down any combination of fields by dragging them from the field area at the top of the table to either of the axes. For example, to show how many isolates have alleles designated and sequence regions tagged for each locus, drag the ‘designated’ and ‘tagged’ fields to the x-axis selector.
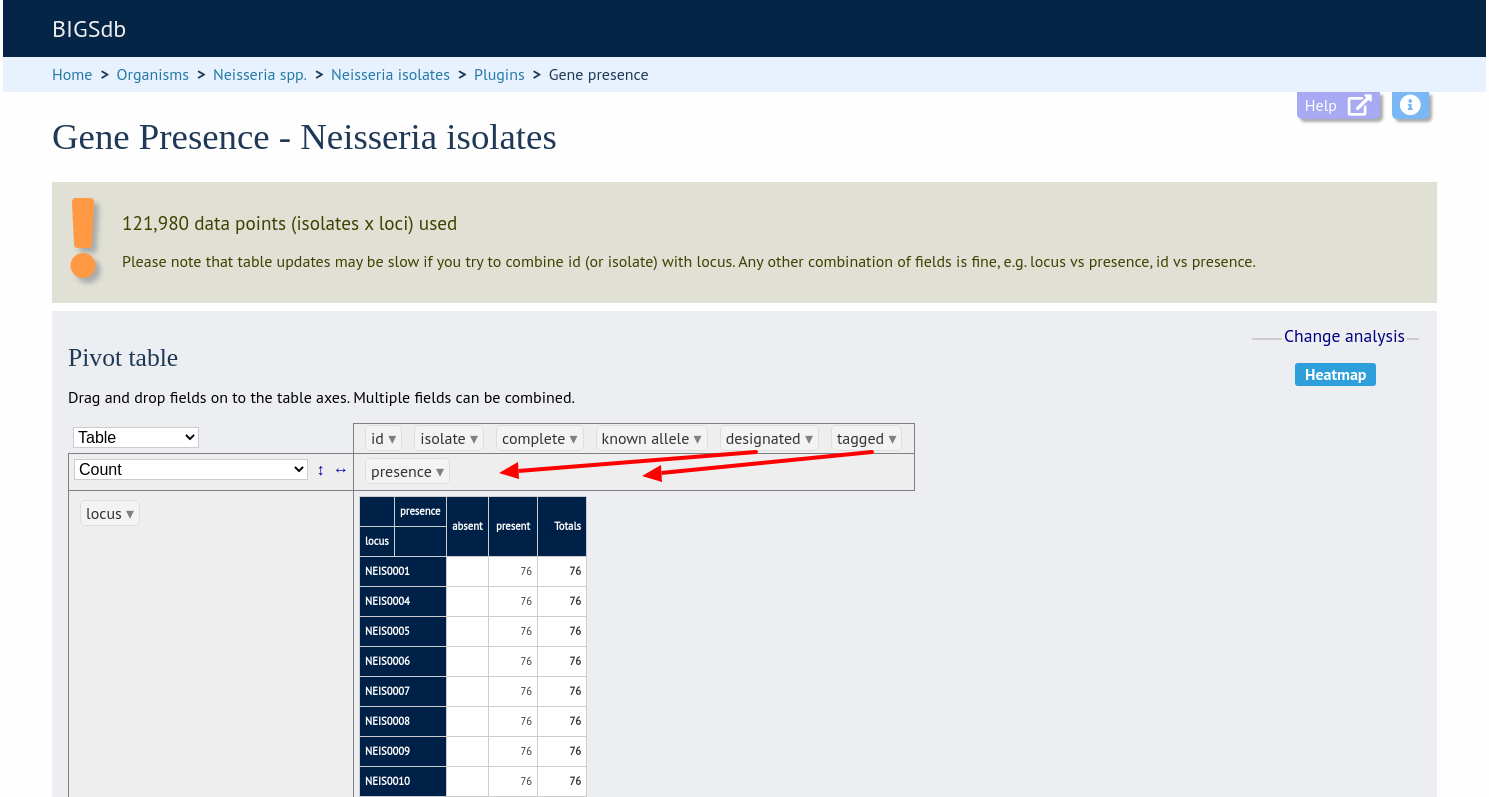
The table will be re-drawn including these fields.
Note
If your dataset has more than 100,000 data points (locus x isolates), then be aware that combining both id (or isolate) and locus within the table will result in sluggish performace. Any other combination of fields should be fine.
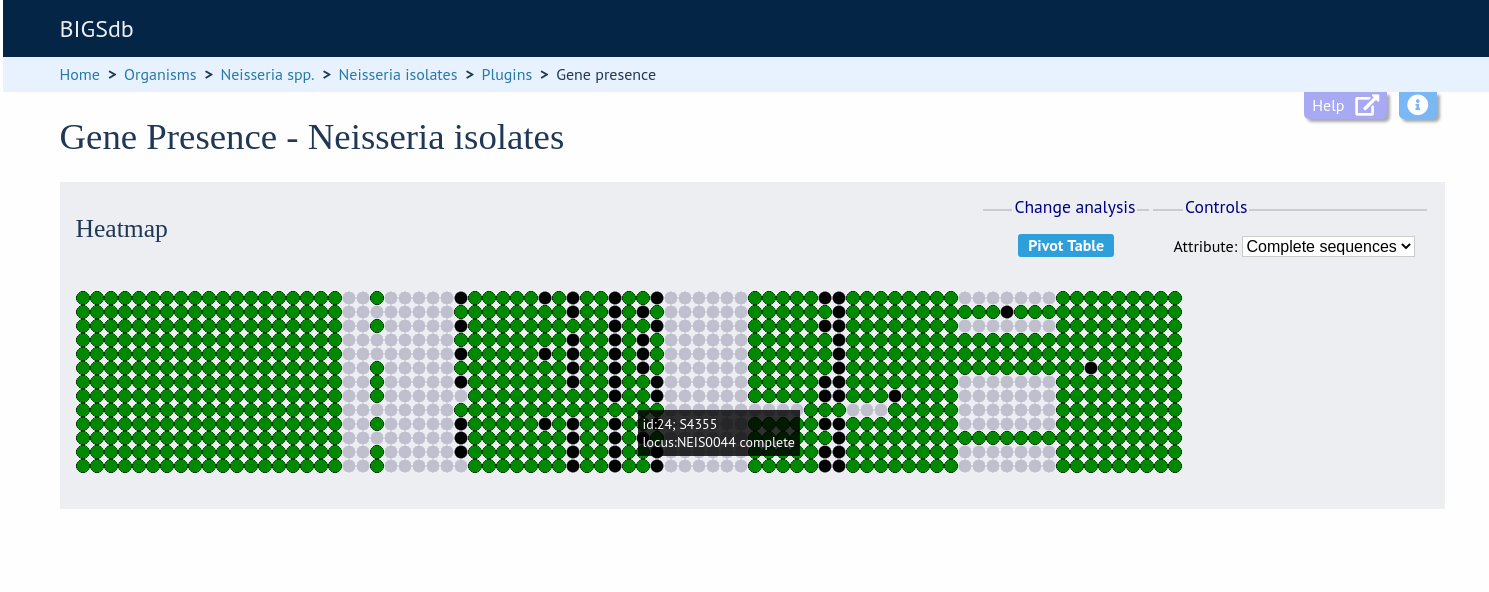
Heatmap
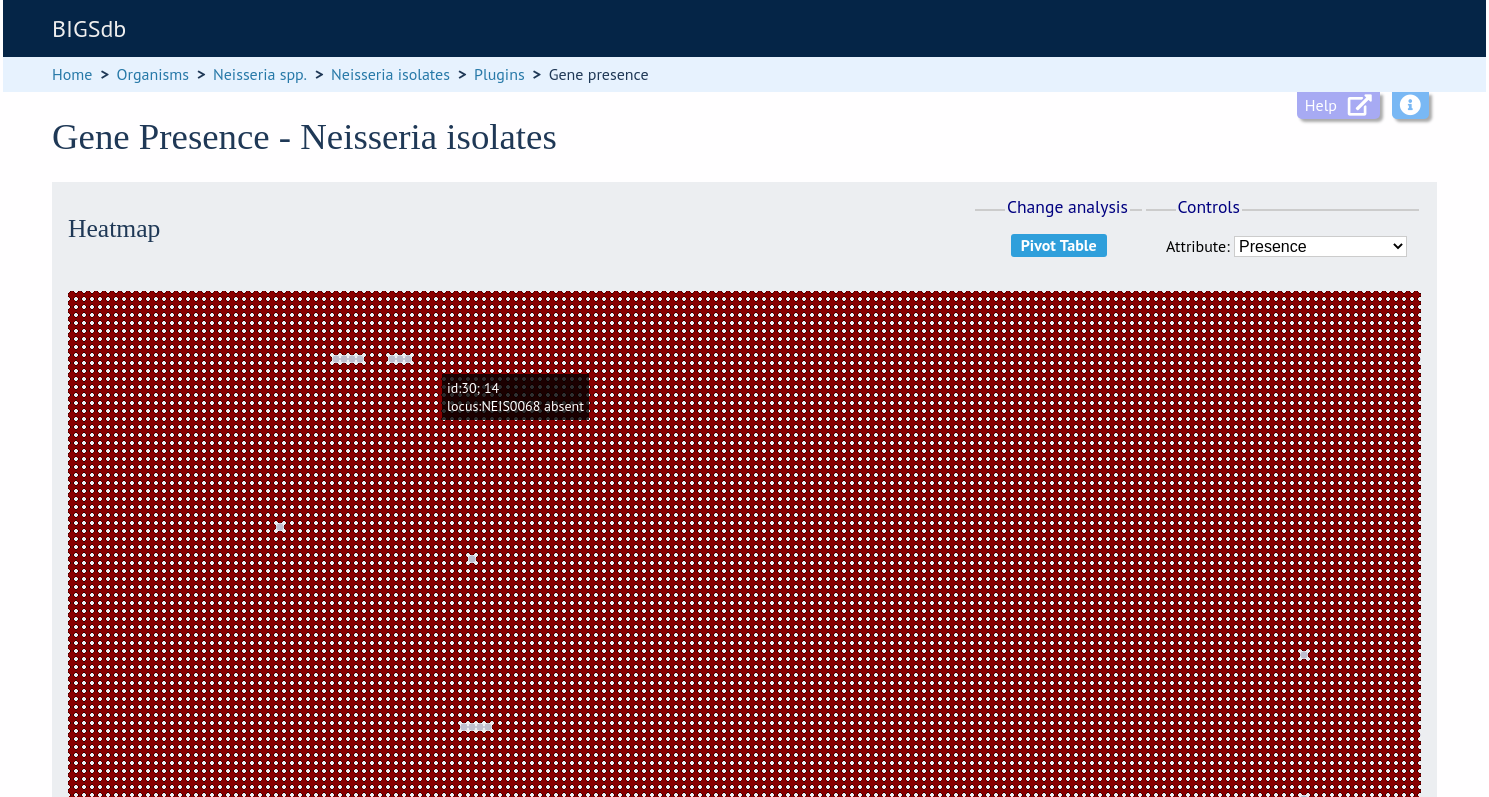
Clicking the ‘Heatmap’ button will display an interactive heatmap. By default the display shows the presence or absence of a locus for each isolate.
Hovering the mouse cursor or touching a region will identify the isolate and locus in a tooltip.
Change the attribute that is displayed by changing the selection in the attribute dropdown box:
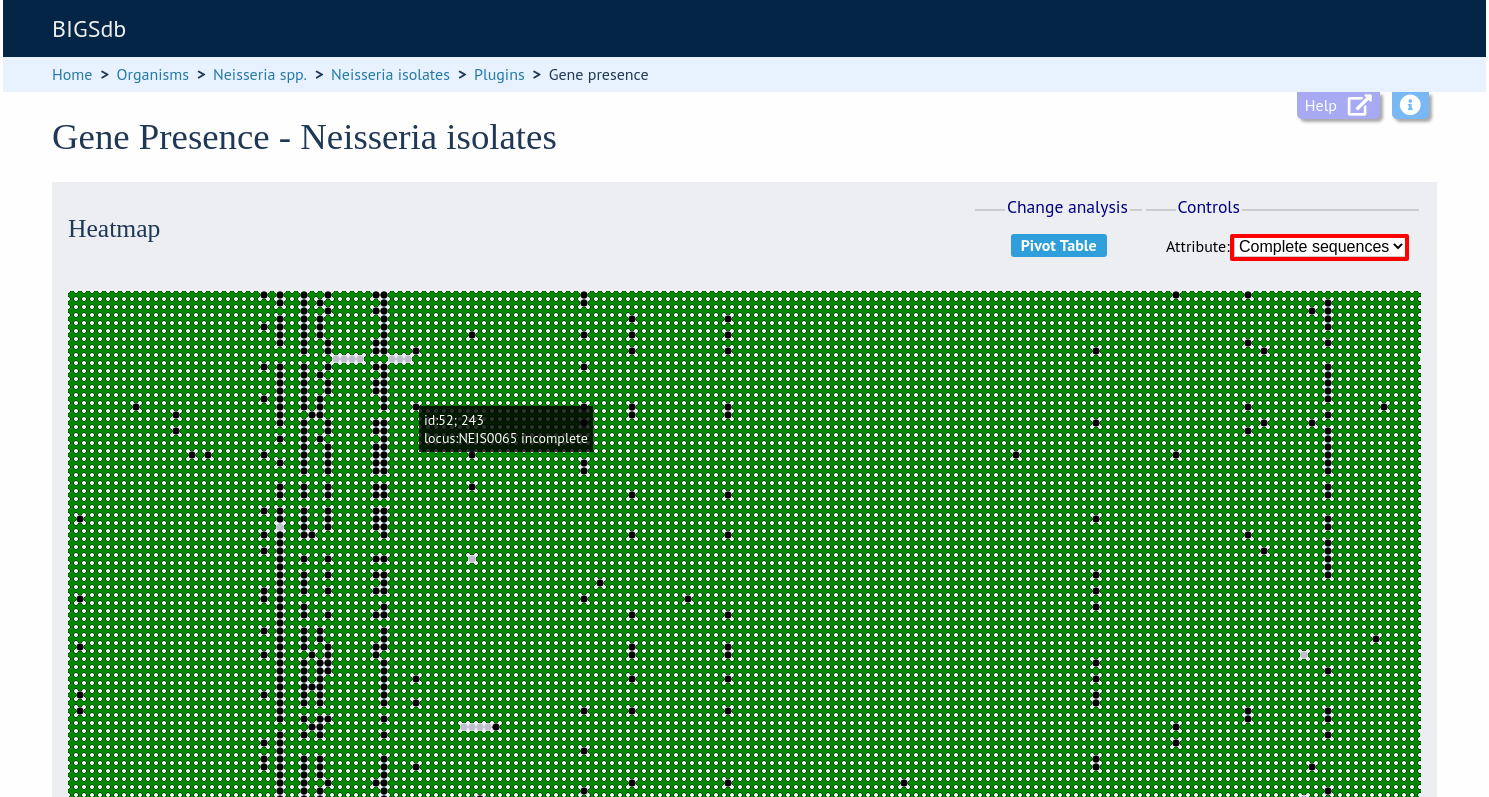
The heatmap does scale to the number of records required to be displayed. If you find individual points to be too small, then choose a smaller subset of data to display: