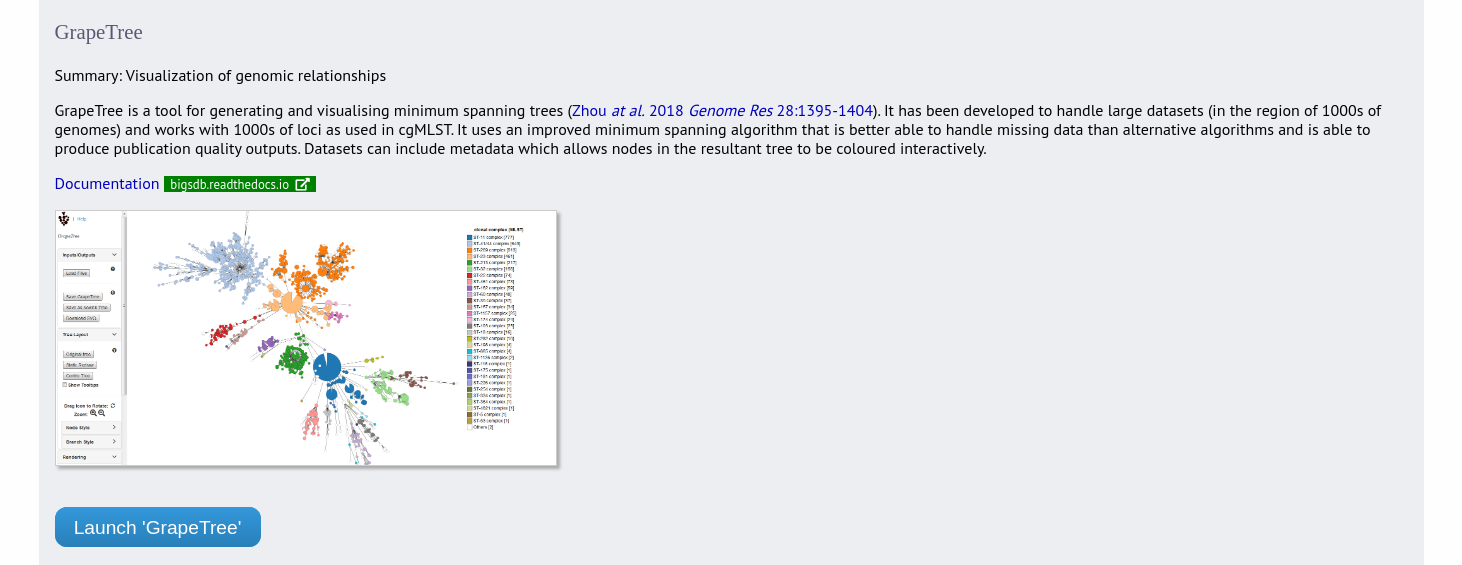
GrapeTree
GrapeTree is a tool for generating and visualising minimum spanning trees. It has been developed to handle large datasets (in the region of 1000s of genomes) and works with 1000s of loci as used in cgMLST. It uses an improved minimum spanning algorithm that is better able to handle missing data than alternative algorithms and is able to produce publication quality outputs. Datasets can include metadata which allows nodes in the resultant tree to be coloured interactively.
The function can be accessed by expanding the ‘Analysis’ section on the main contents page.
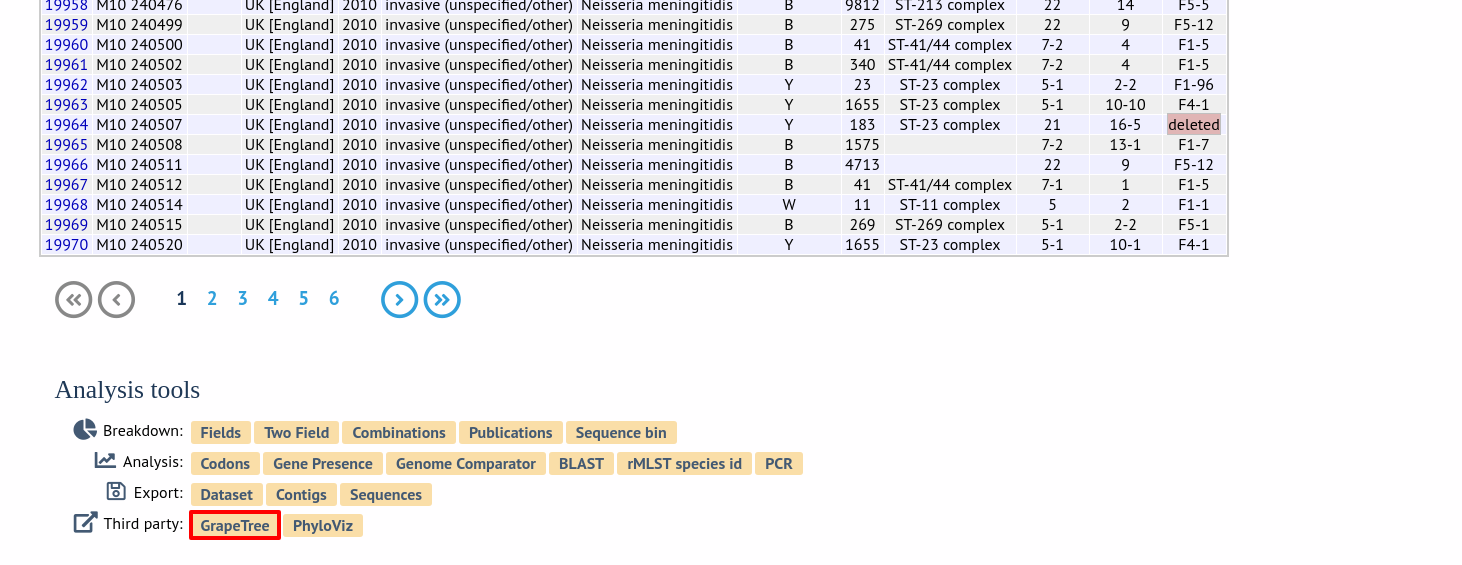
Alternatively, it can be accessed following a query by clicking the ‘GrapeTree’ button at the bottom of the results table. Isolates returned from the query will be automatically selected within the GrapeTree interface.
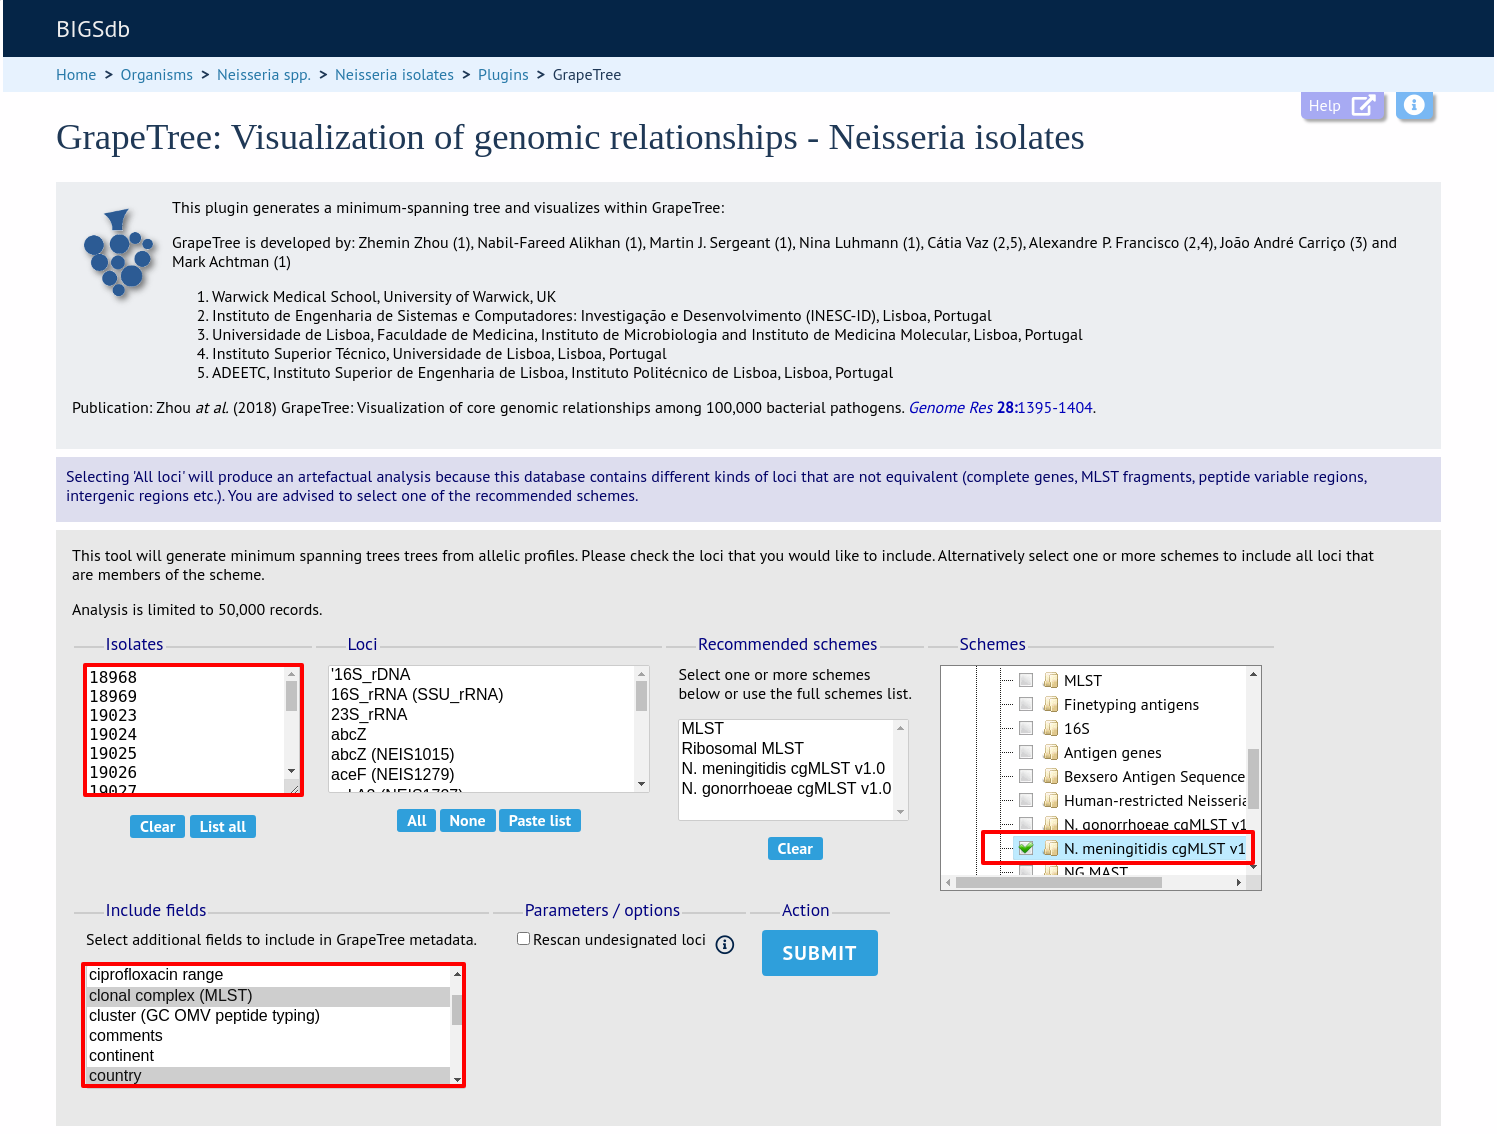
Select the isolates to include. The tree can be generated from allelic profiles of any selection of loci, or more conveniently, you can select a scheme in the scheme selector, or choose from recommended schemes if these have been set, to include all loci belonging to that scheme.
Additional fields can be selected to be included as metadata for use in colouring nodes - select any fields you wish to include. Finally you can choose the analysis method from the following:
MSTreeV2 - Improved minimum-spanning tree that better handles missing data (default)
MSTree - Classical minimum-spanning tree similar to PhyloViz
NJ - FastME V2 Neighbour-joining tree
RapidNJ - RapidNJ Neighbour-joining tree for very large datasets
Click ‘Submit’ to start the analysis.
The job will be sent to the job queue. When it has finished, click the button marked ‘Launch GrapeTree’.

The generated tree will be rendered in the GrapeTree application page.
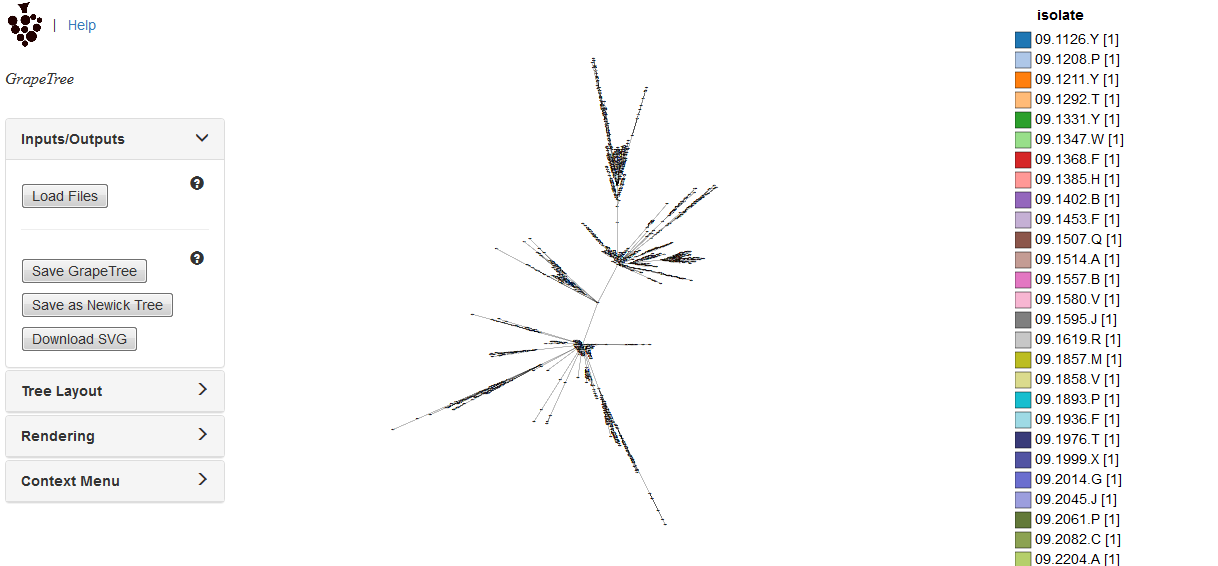
The image can be manipulated in various ways. These include modifying the tree layout, customising node labels and size, modifying branch lengths and collapsing branches. The image can be saved in SVG format which can be further edited in image publishing software such as Inkscape.
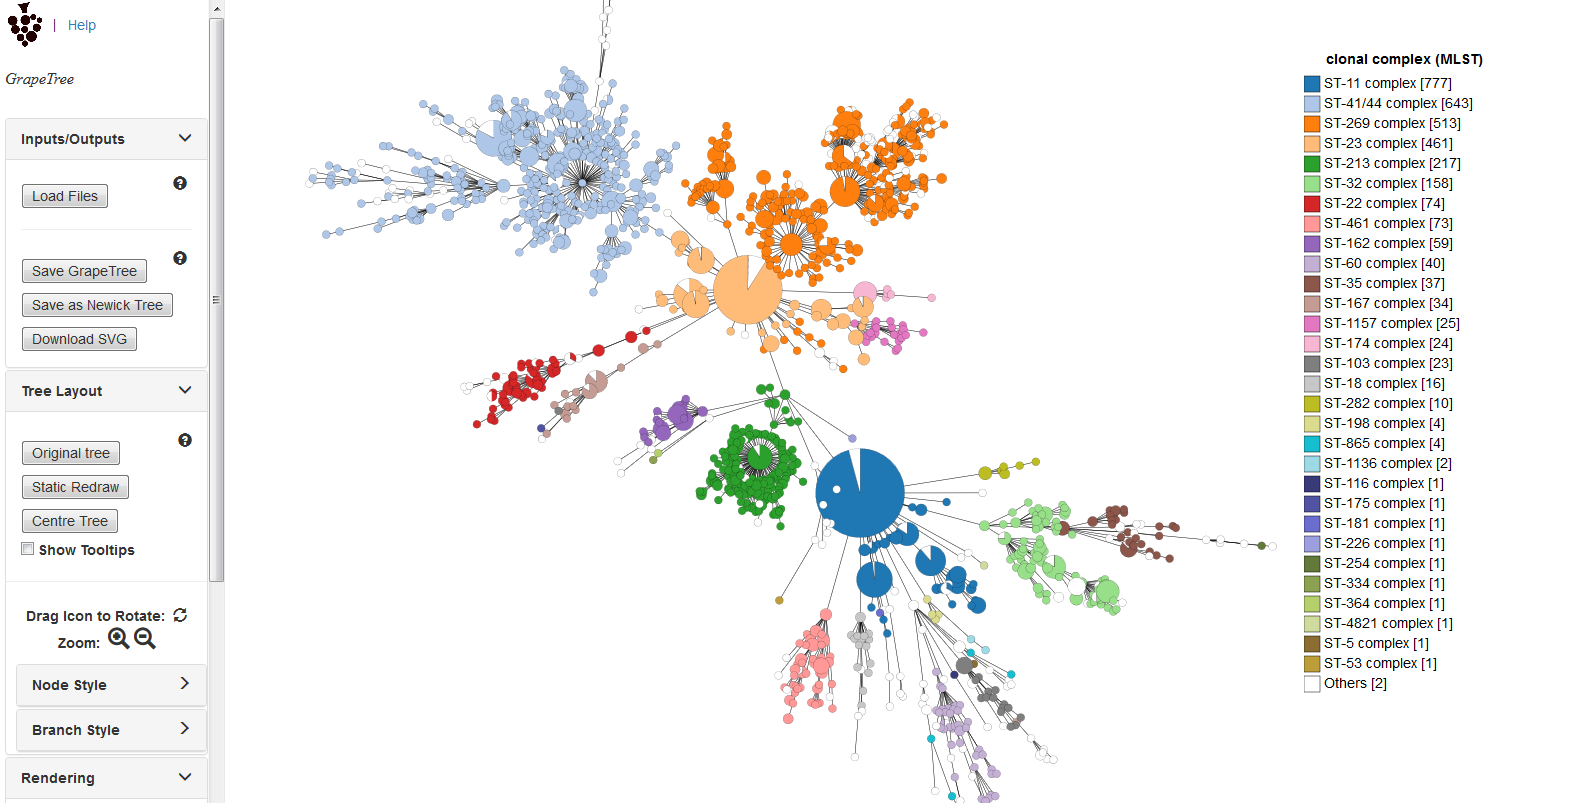
As an example, the default cgMLST tree (above) has been modified (below) as follows:
Nodes coloured by clonal complex
Labels removed
Branches collapsed where <=100 loci different
Node size set to 200%
Kurtosis (node size relative to number of isolates) set to 75%
Dynamic rendering allowed to run to fan out nodes
Full details can be found in the GrapeTree manual.
Note
GrapeTree has been described in the following publication:
Z Zhou, NF Alikhan, MJ Sergeant, N Luhmann, C Vaz, AP Francisco, JA Carrico, M Achtman (2018) GrapeTree: Visualization of core genomic relationships among 100,000 bacterial pathogens. Genome Res 28:1395-1404.