ReporTree
ReporTree is a pan-pathogen tool for automated and reproducible identification and characterization of genetic clusters.
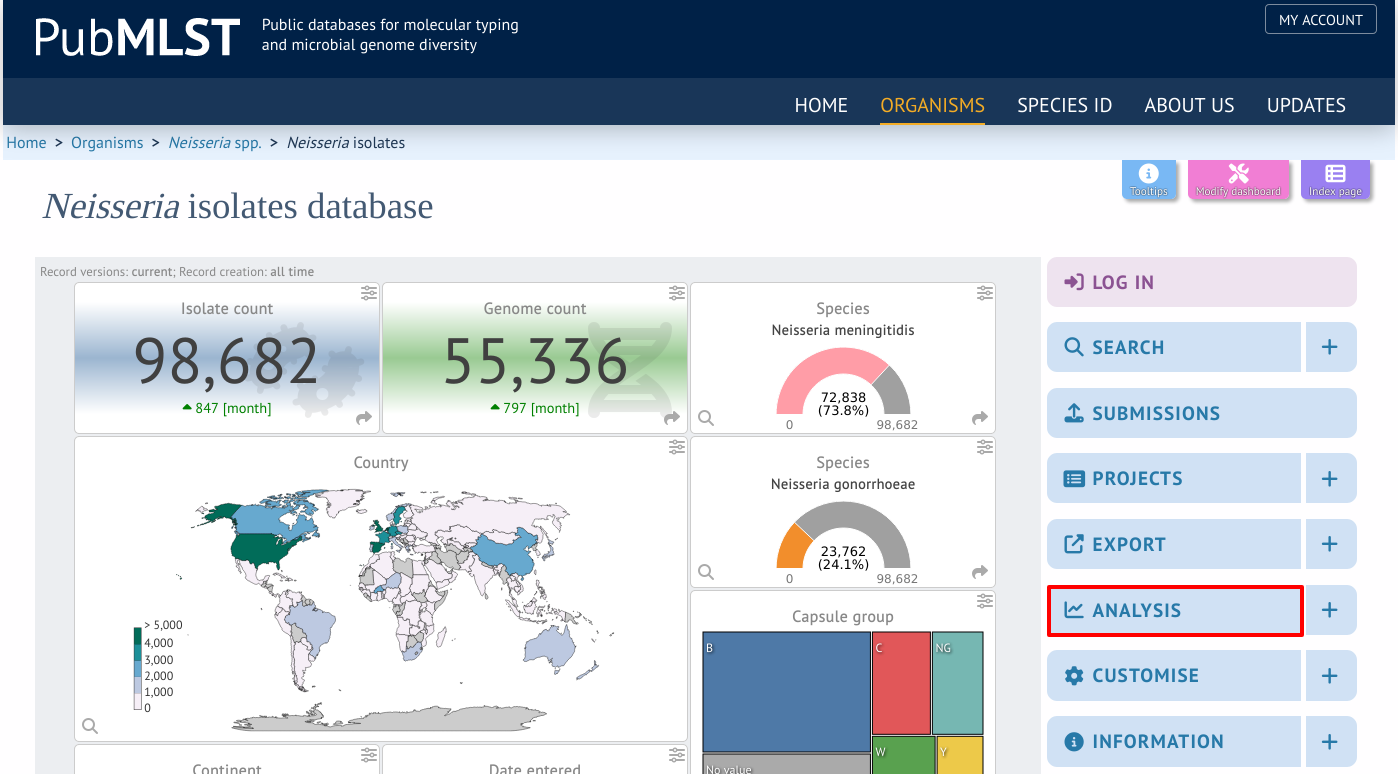
ReporTree can be accessed by selecting the ‘Analysis’ section on the main contents page.
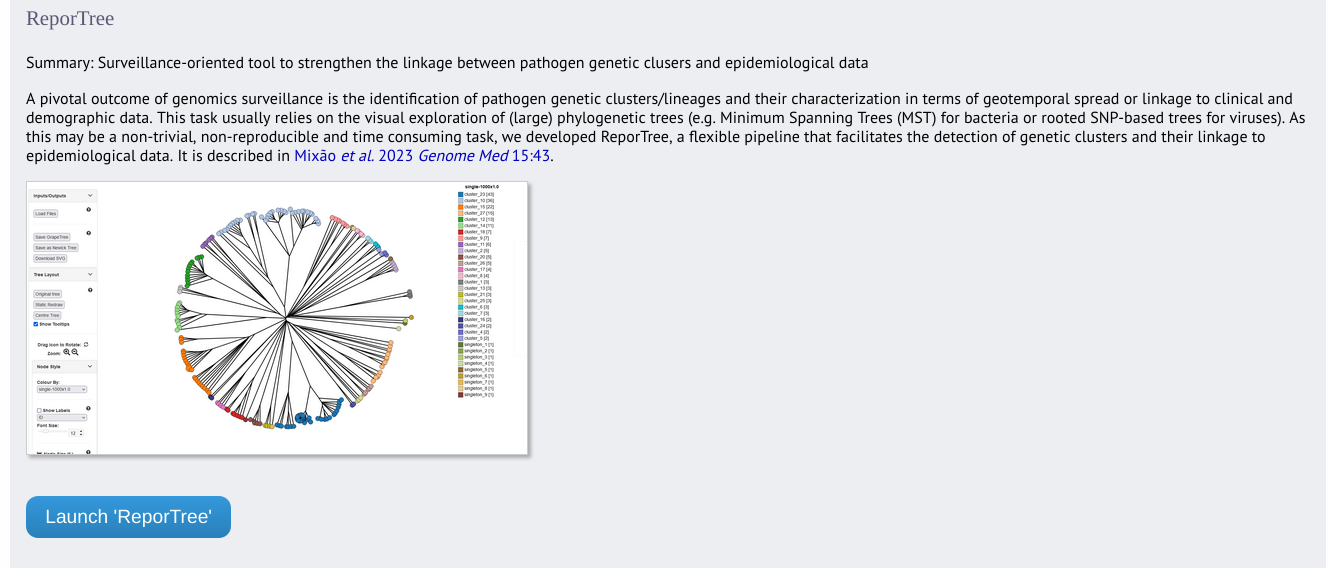
Jump to the ‘Third party’ category, follow the link to ReporTree, then click ‘Launch ReporTree’.
ReporTree can be accessed from the contents page by clicking the ‘ReporTree’ link.
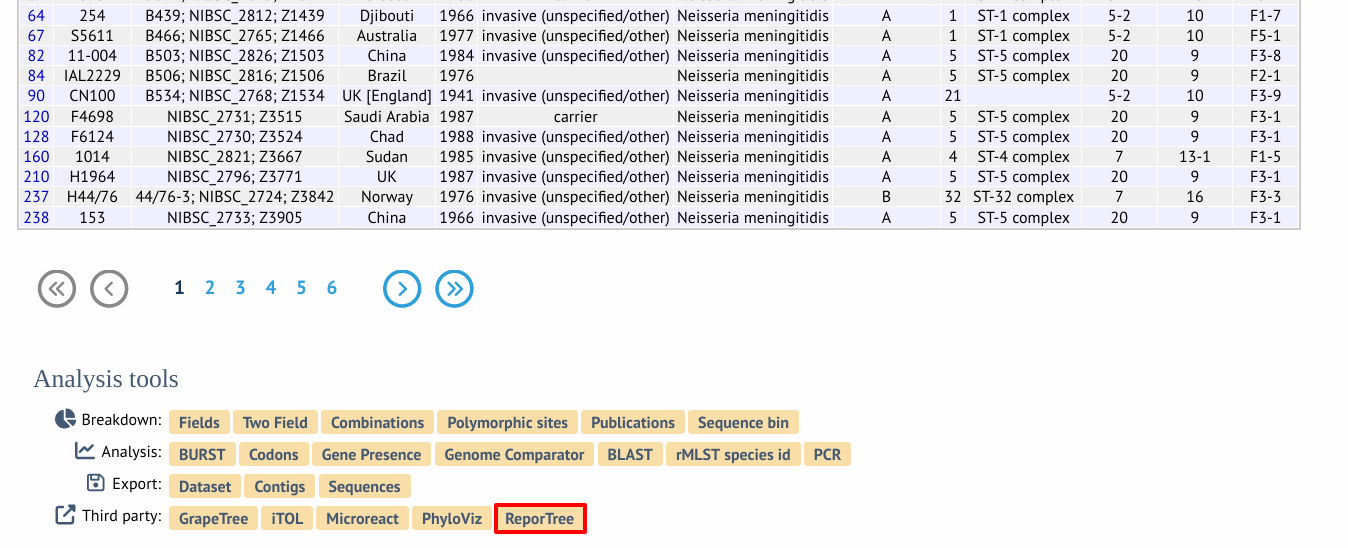
Alternatively, it can be accessed following a query by clicking the ‘ReporTree’ button at the bottom of the results table. Isolates returned from the query will be automatically selected within the GrapeTree interface.
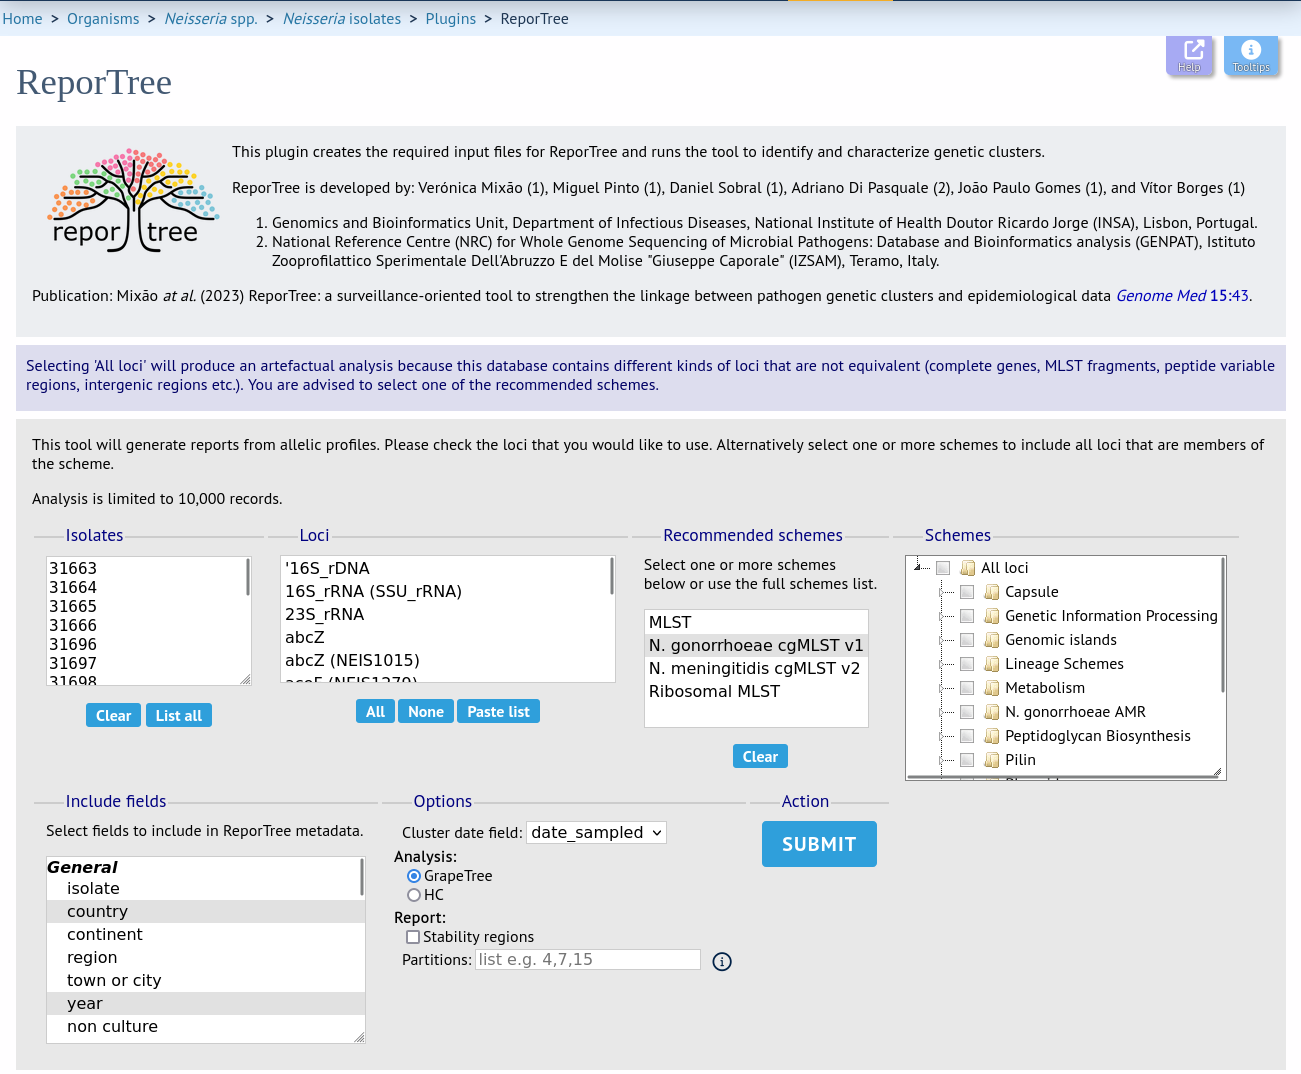
Select the isolates to include. Trees and clusters can be generated from allelic profiles of any selection of loci, or more conveniently, you can select a scheme in the scheme selector, or choose from recommended schemes if these have been set, to include all loci belonging to that scheme.
Additional fields can be selected to be included as metadata for use in colouring nodes and for inclusion in the partition summary - select any fields you wish to include. Multiple selections can be made by holding down shift or ctrl while selecting.
You can also select any date field which will be used in cluster definitions to indicate the first and last dates of the cluster as well as its total duration. This should ideally represent the date of sampling.
Finally, you can choose to use GrapeTree and HC methods for clustering and a comma-separated list of partitions defined by locus differences, e.g. ‘4,7,15’. Alternatively, you can choose to calculate and display ‘stability regions’ which will include the first partition of each stability region (threshold ranges in which cluster composition is similar).
Click ‘Submit’ to start the analysis.
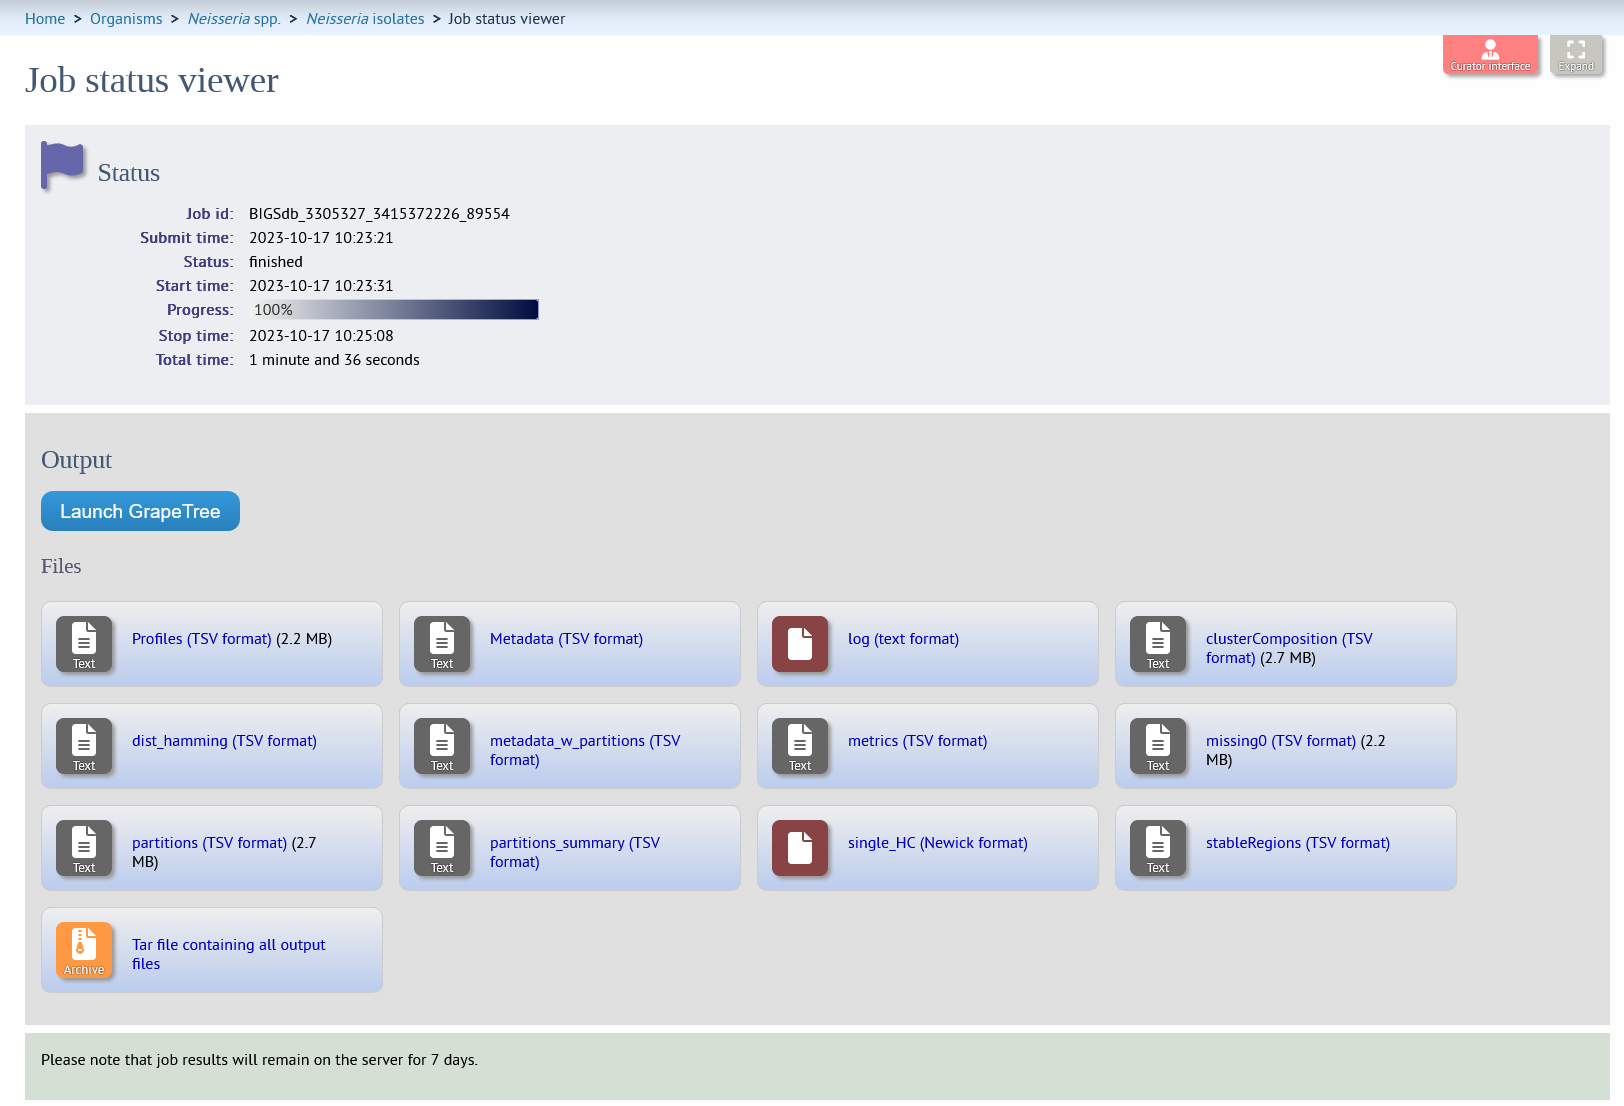
The job will be sent to the job queue. When it has finished, you should see a link to load the resultant tree in GrapeTree and a list of output files.
Note
ReporTree has been described in the following publication:
V Mixão, M Pinto, D Sobral, A Di Pasquale, J Gomes, V Borges (2023) ReporTree: a surveillance-oriented tool to strengthen the linkage between pathogen genetic clusters and epidemiological data Genome Med 15:43.
It also makes use of the following tools which should also be cited:
cgmlst-dists: https://github.com/tseemann/cgmlst-dists for original code and https://github.com/genpat-it/cgmlst-dists for improvements regarding memory efficiency.
If you requested a GrapeTree analysis:
Z Zhou, NF Alikhan, MJ Sergeant, N Luhmann, C Vaz, AP Francisco, JA Carriço, M Achtman (2018) GrapeTree: Visualization of core genomic relationships among 100,000 bacterial pathogens. Genome Res 28:1395-1404.
If you requested ‘stability regions’:
JA Carriço, C Silva-Costa, J Melo-Cristino, FR Pinto, H de Lencastre, JS Almeida, M Ramirez (2006) Illustration of a common framework for relating multiple typing methods by application to macrolide-resistant Streptococcus pyogenes. J Clin Microbiol 44:2524-32.
DOR Barker, JA Carriço, P Kruczkiewicz, F Palma, M Rossi, EN Taboada (2018) Rapid identification of stable clusters in bacterial populations using the Adjusted Wallace Coefficient. BioRxiv DOI: https://doi.org/10.1101/299347.