LINvis
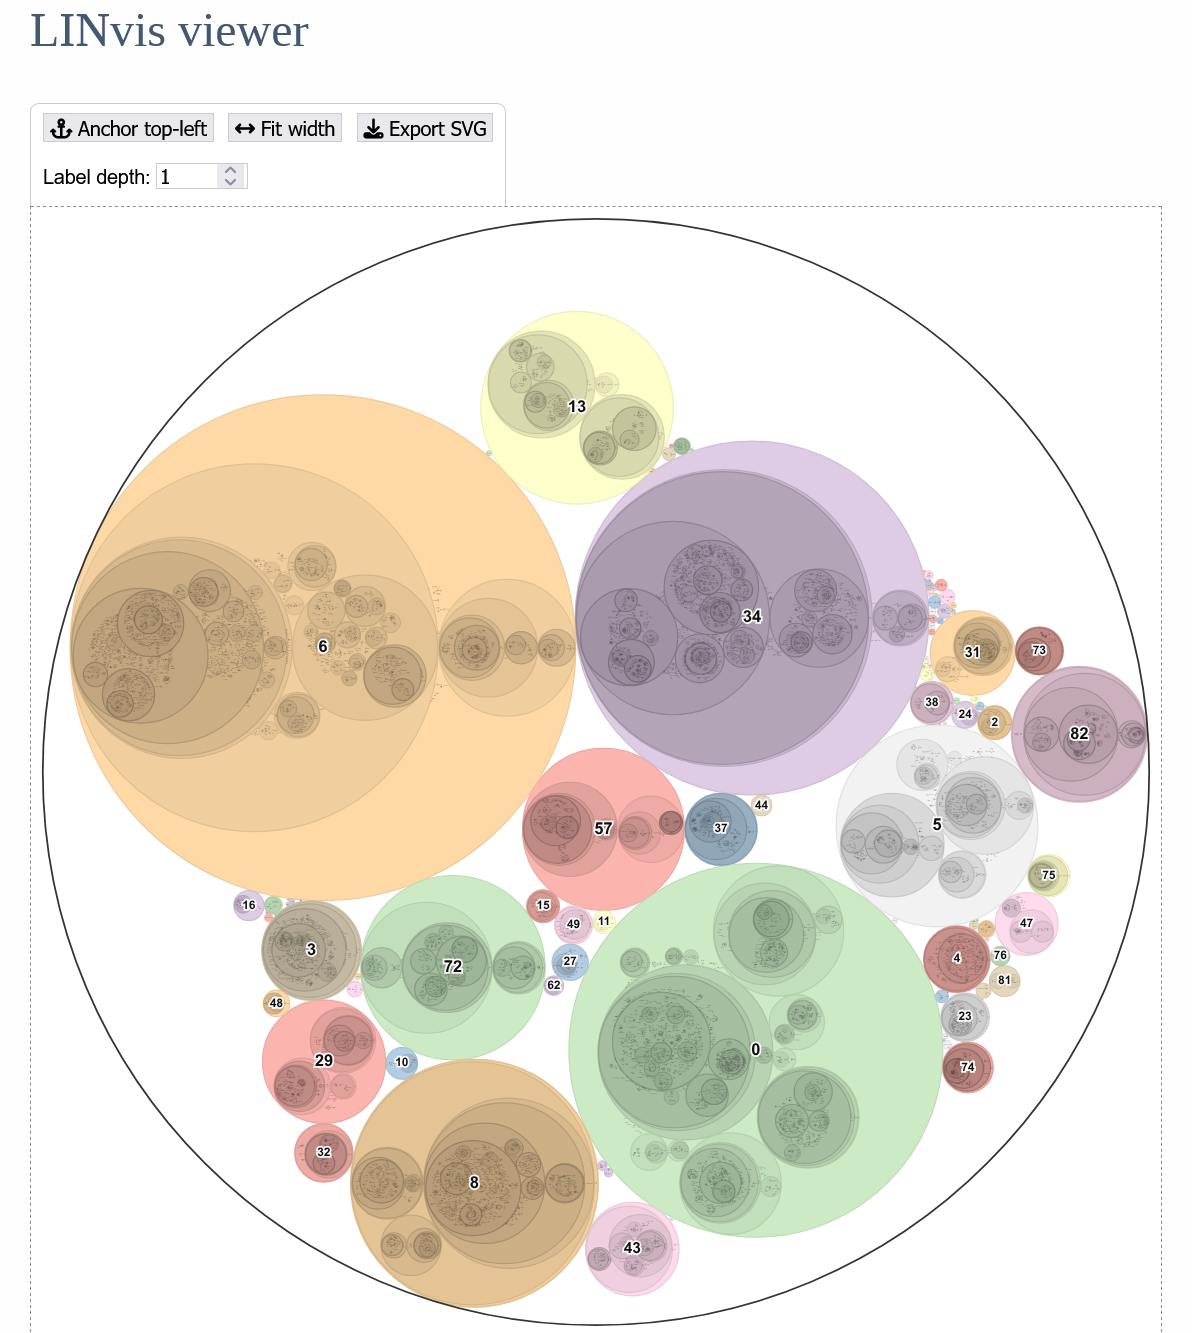
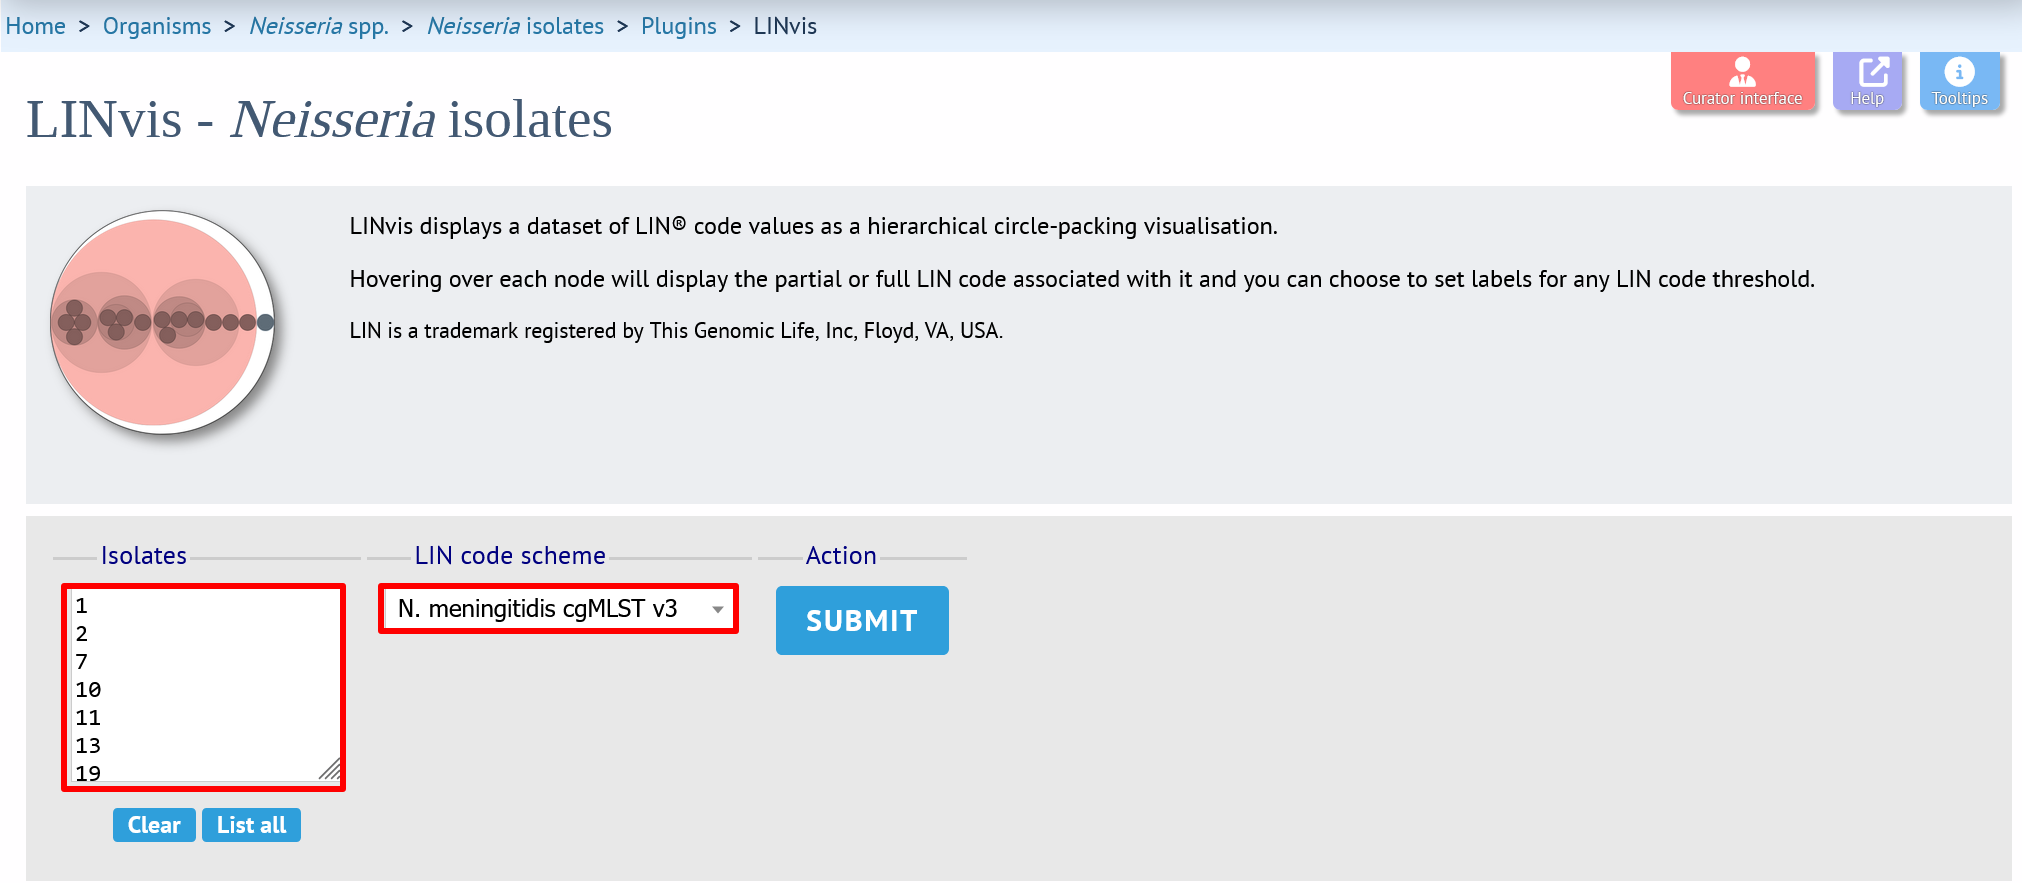
LINvis displays a dataset of LIN® code values as a hierarchical circle-packing visualisation. Hovering over each node will display the partial or full LIN code associated with it and you can choose to set labels for any LIN code threshold.
The visualisation can be exported as a SVG file for further manipulation or for publication.
Note
LIN is a trademark registered by This Genomic Life, Inc, Floyd, VA, USA.
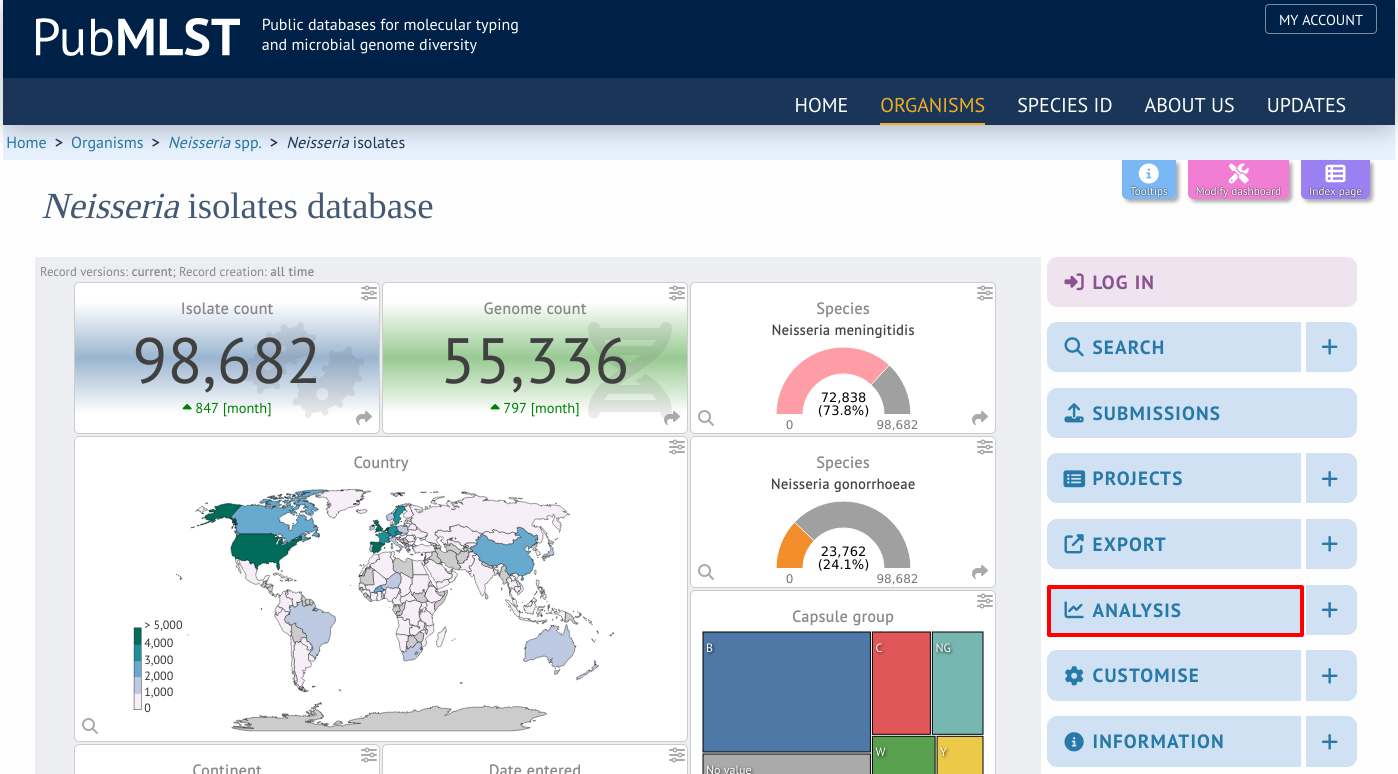
LINvis can be accessed by selecting the “Analysis” section on the main contents page.
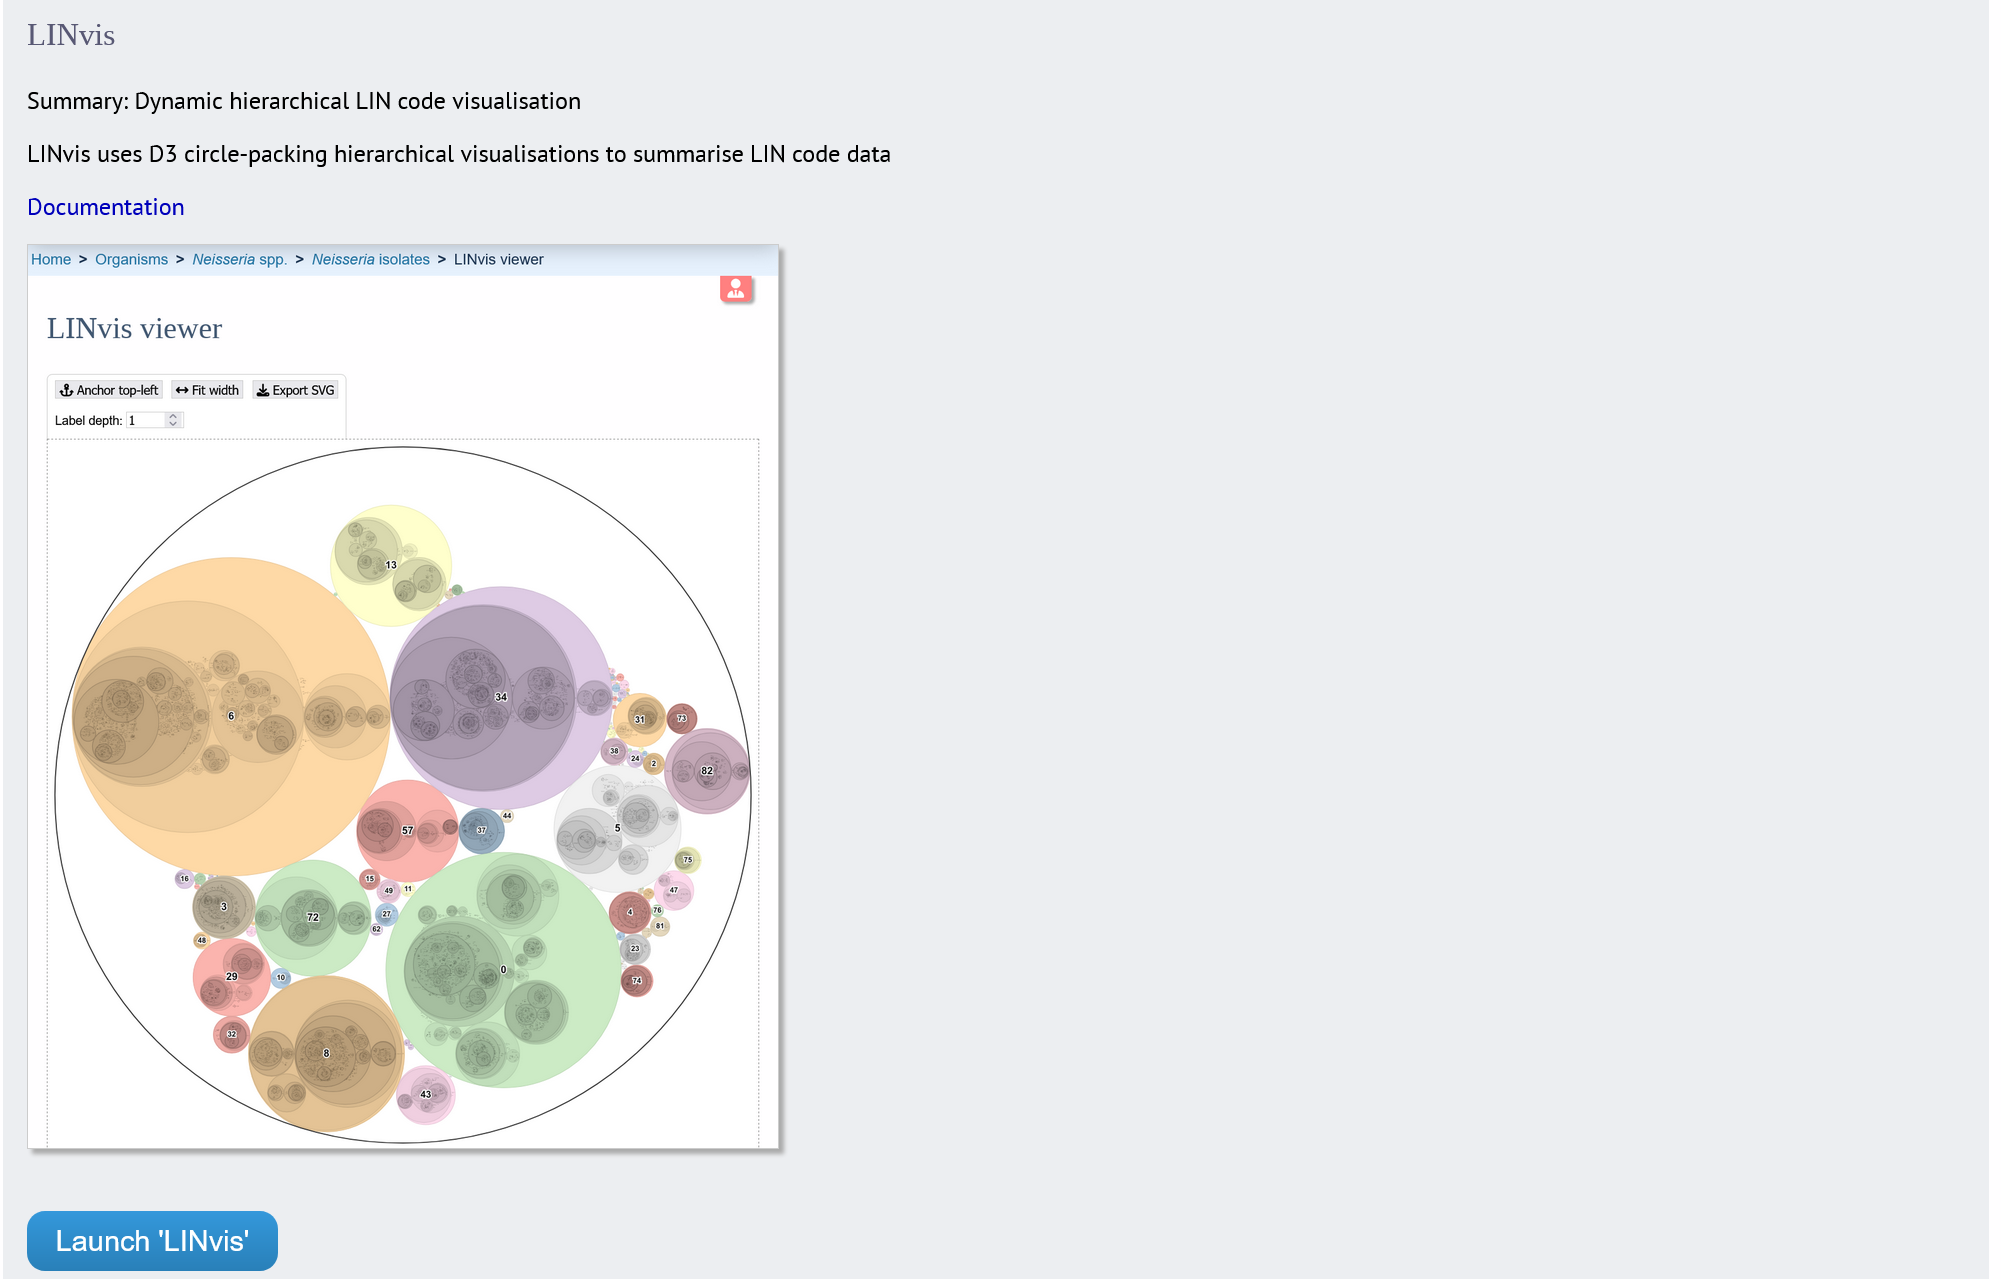
Jump to the “Analysis” category, follow the link to LINvis, then click “Launch LINvis”.
LINvis can be accessed from the contents page by clicking the “LINtree” link.
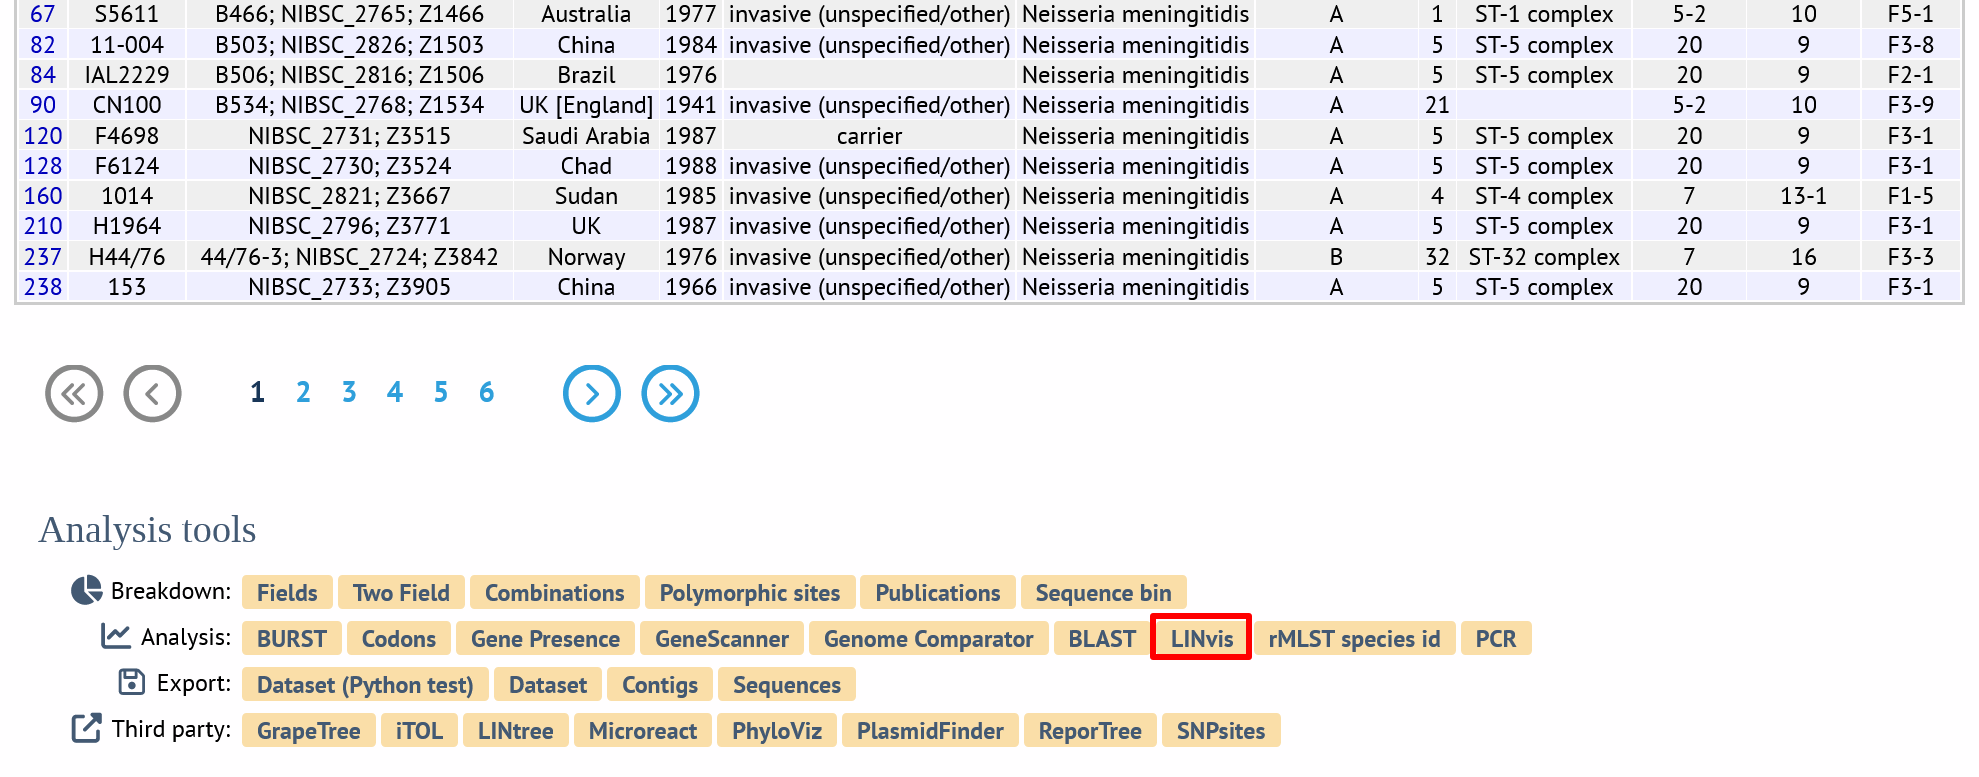
Alternatively, it can be accessed following a query by clicking the “LINvis” button at the bottom of the results table. Isolates returned from the query will be automatically selected within the LINvis interface.
Select the isolates to include. If there is more than one scheme in the database that has LIN codes assigned, then select the required scheme.
Click “Submit” to start the analysis.
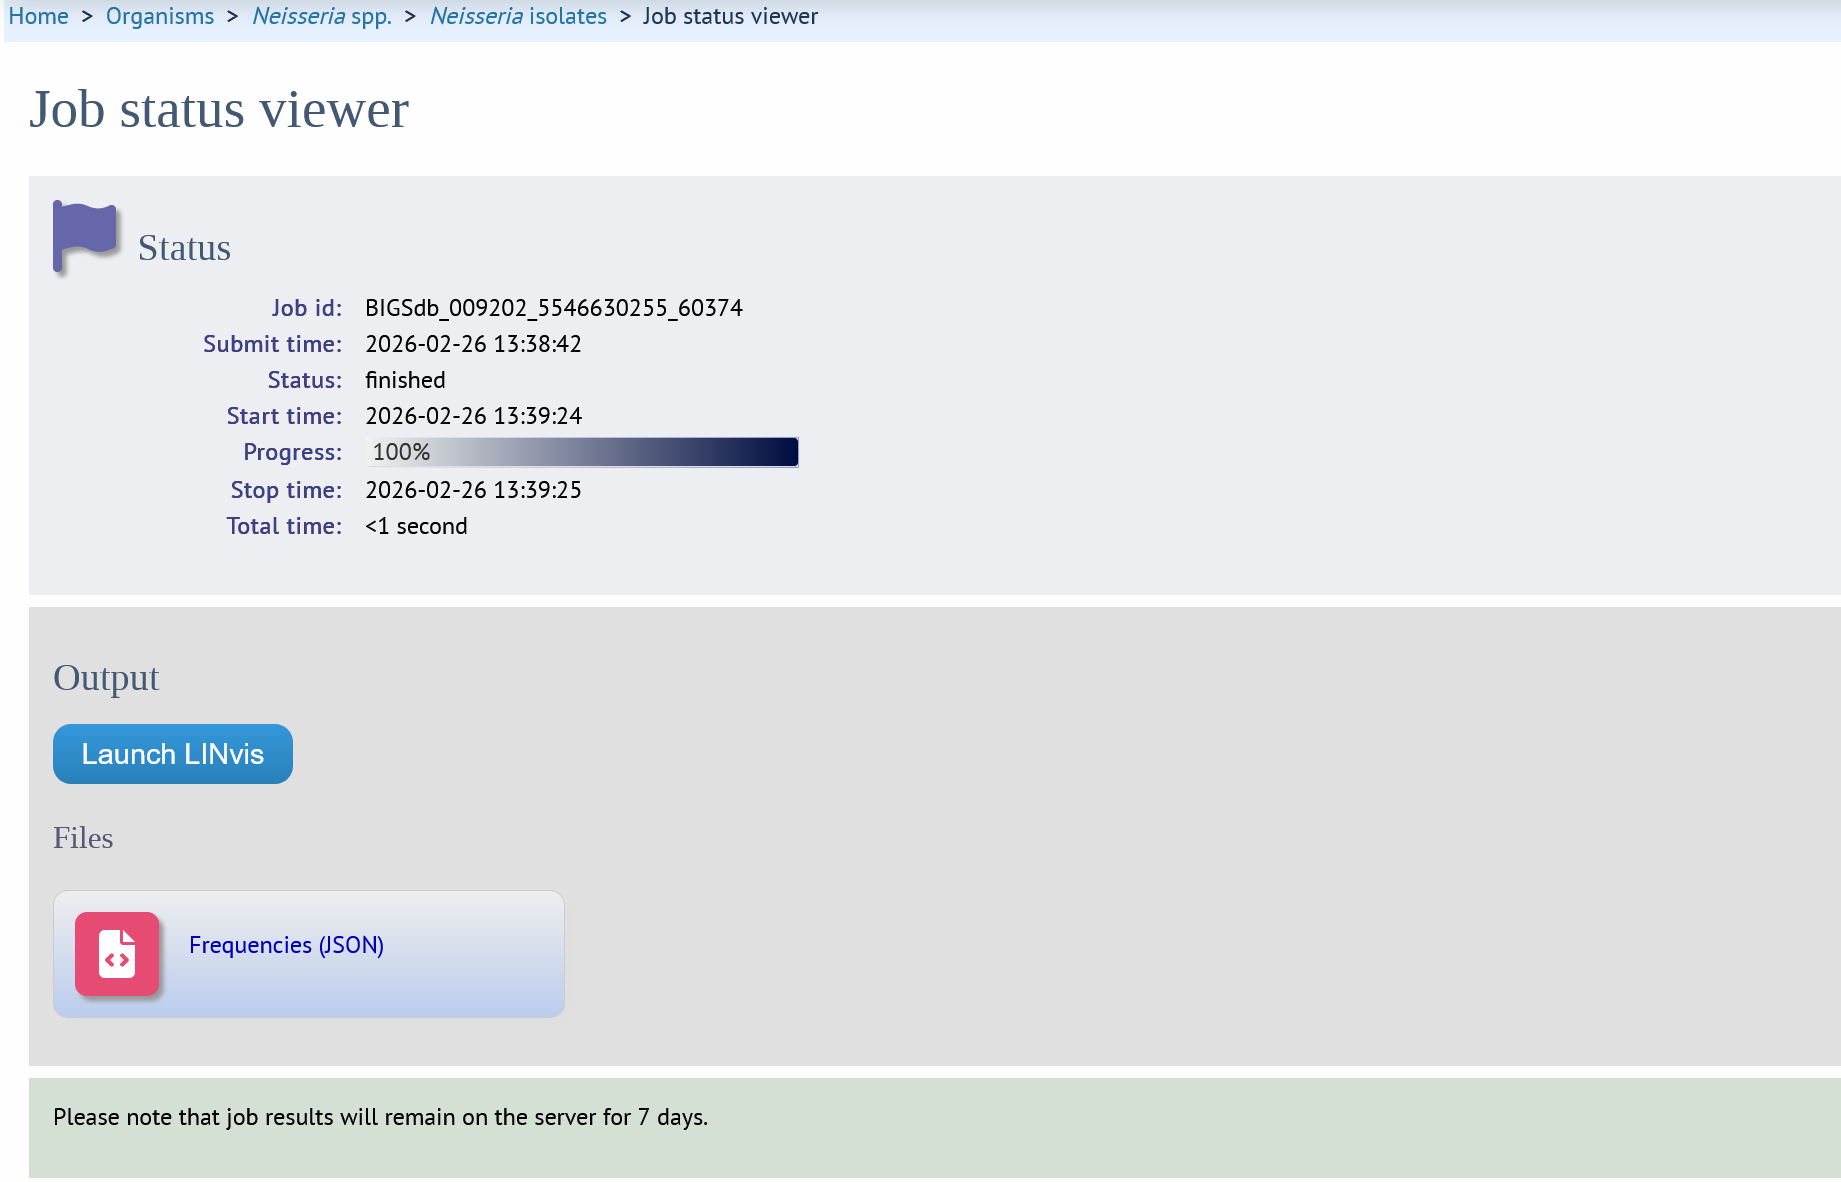
The job will be sent to the job queue. When it has finished, click the button marked “Launch LINvis”. There will also be a JSON format data file that you can download. This can be loaded into the LINvis viewer manually if you open the viewer page without passing a job parameter.
Your browser will open the LINvis viewer and display your visualisation.