LINvis
LINvis displays a dataset of LIN code values as hierarchical visualisations using circle-packing or sunburst algorithms. In either visualisation, hovering over each node will display the partial or full LIN code associated with it and you can choose to set labels for any LIN code threshold.
The visualisation can be exported as a SVG file for further manipulation or for publication.
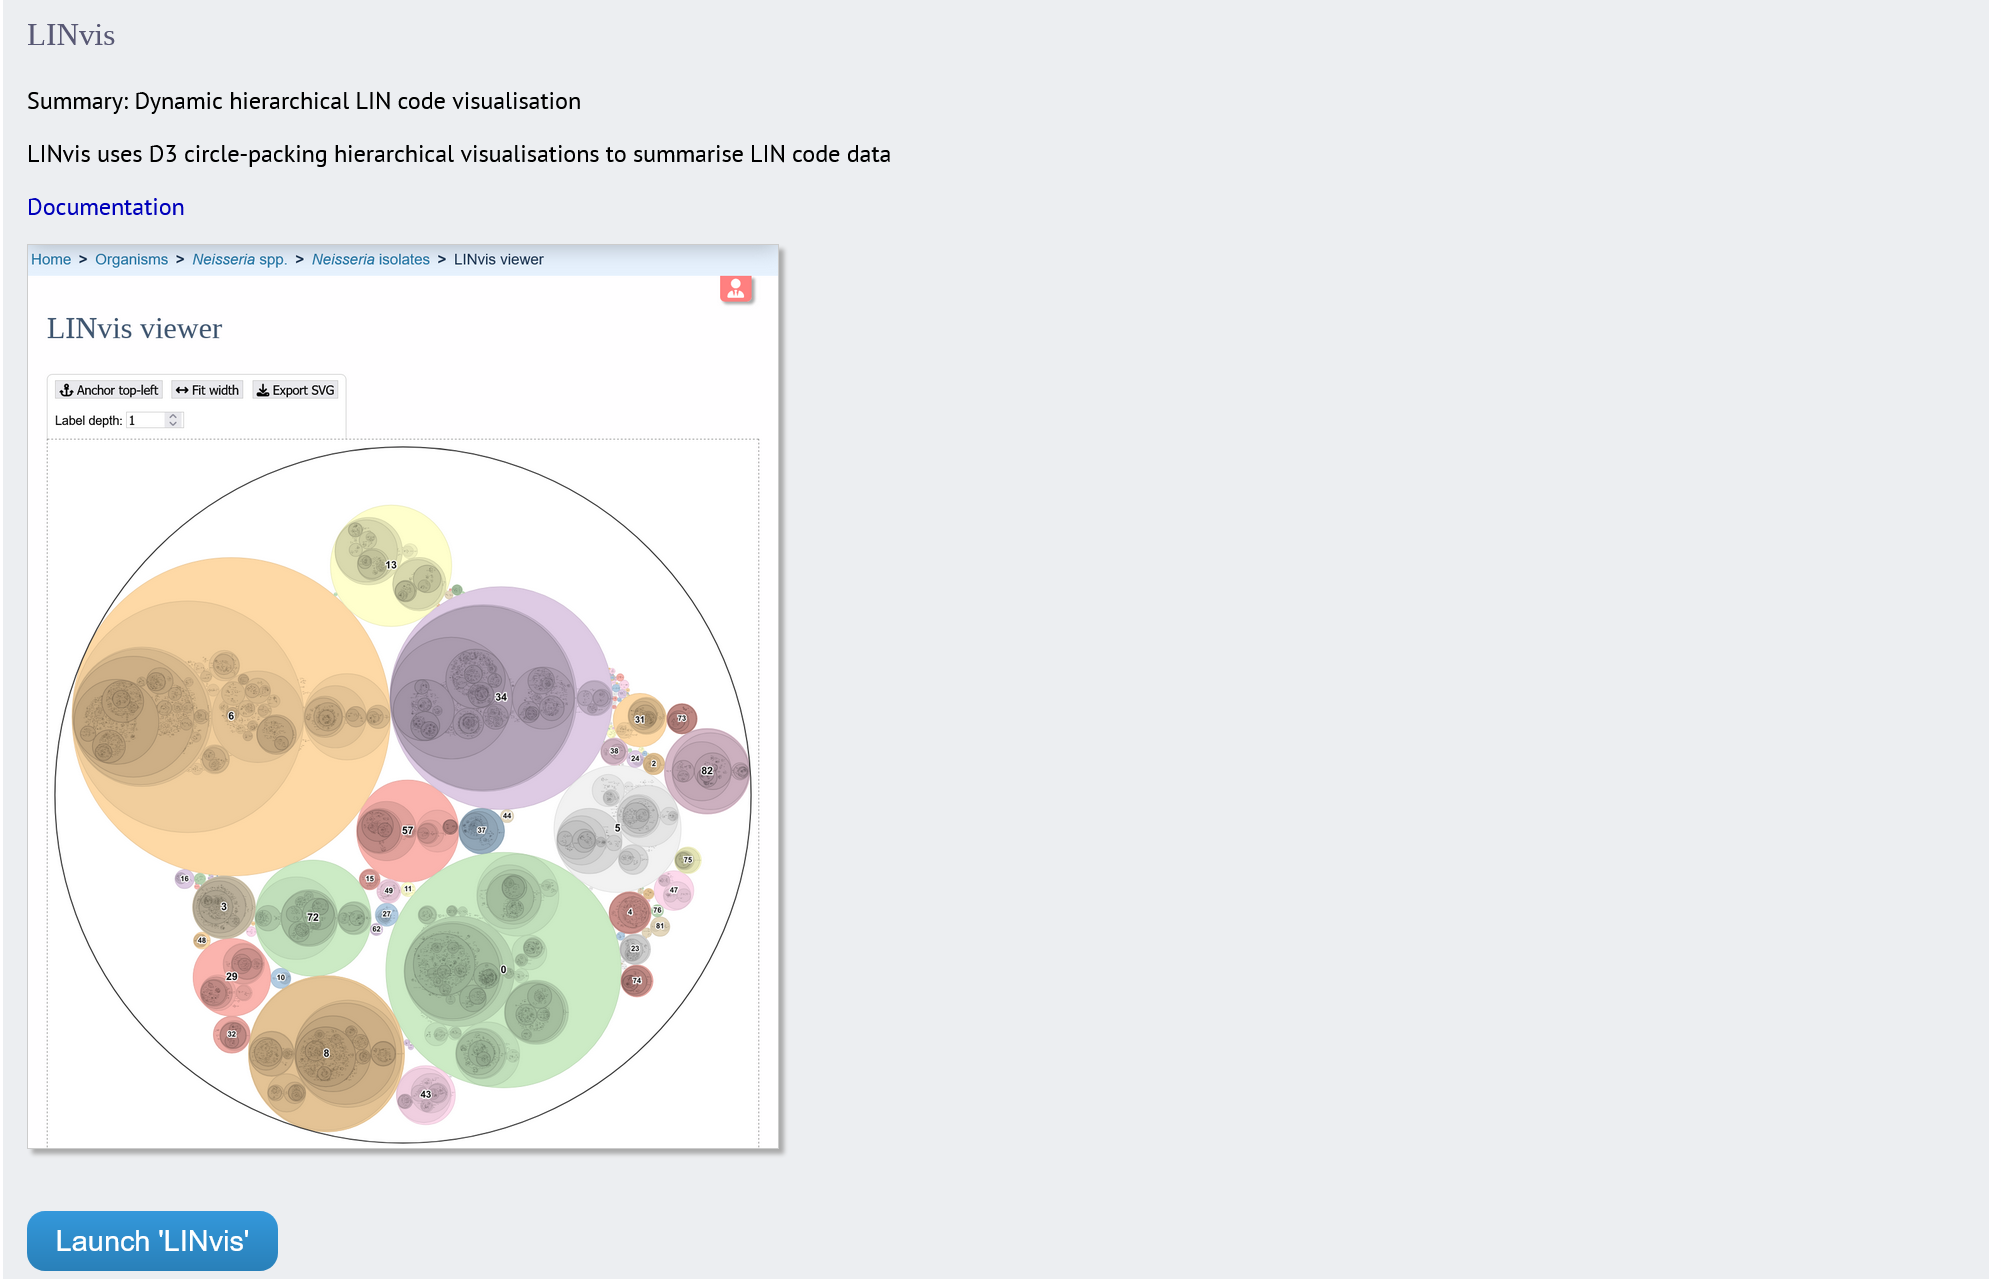
The function can be accessed by expanding the ‘Analysis’ section on the main contents page.
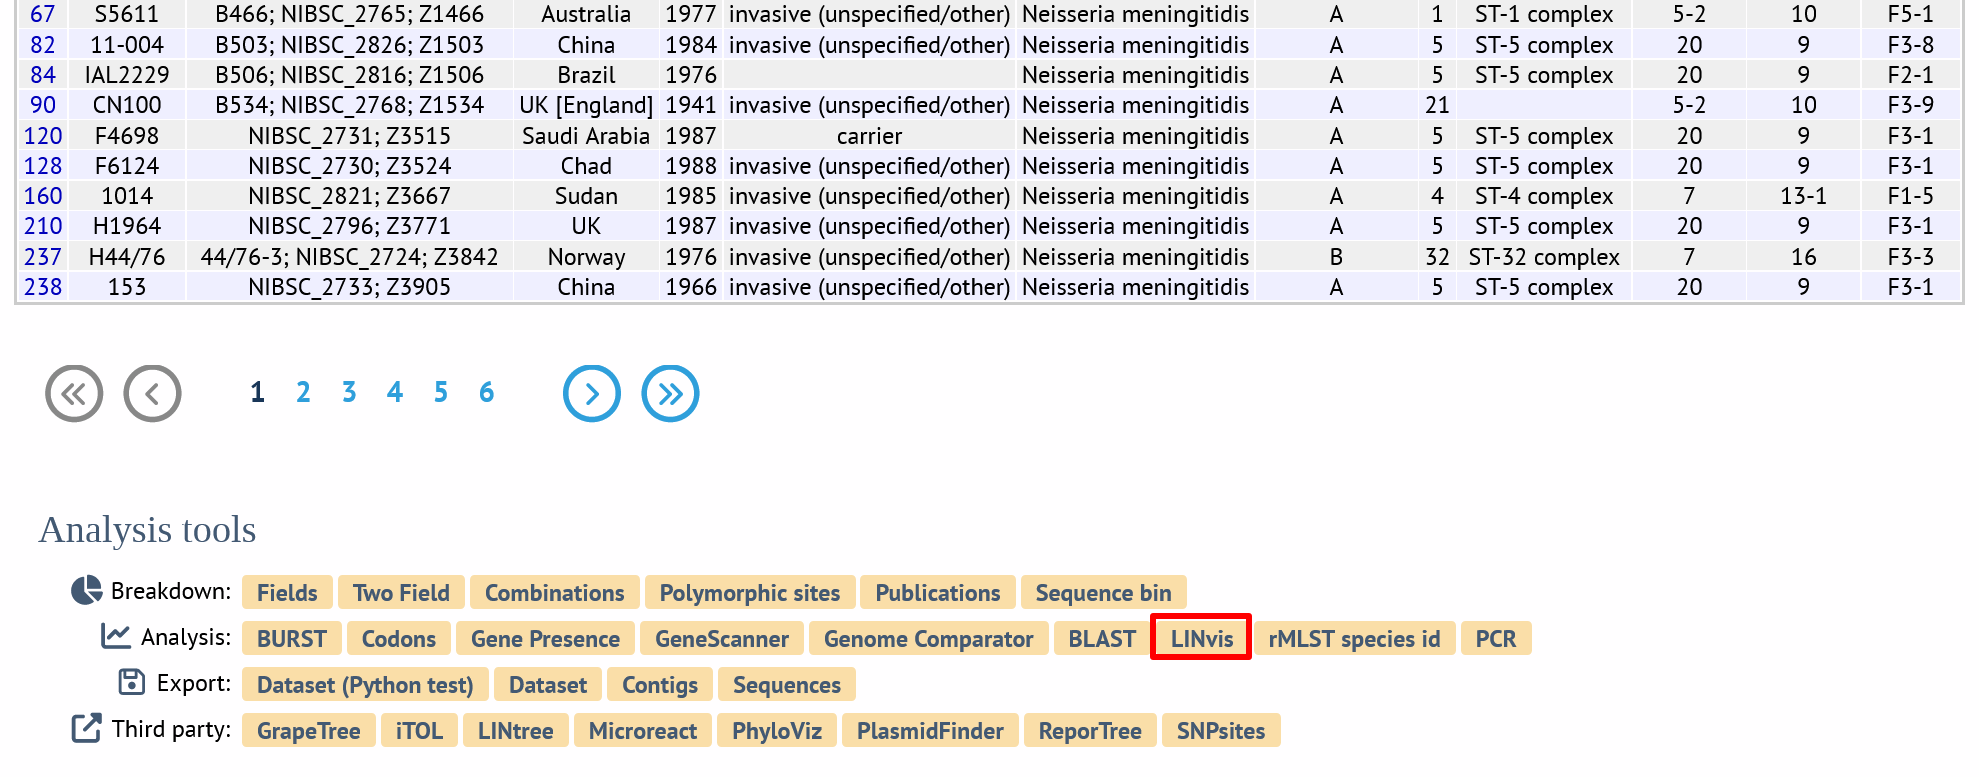
Alternatively, it can be accessed following a query by clicking the ‘LINvis’ button at the bottom of the results table. Isolates returned from the query will be automatically selected within the LINvis interface.
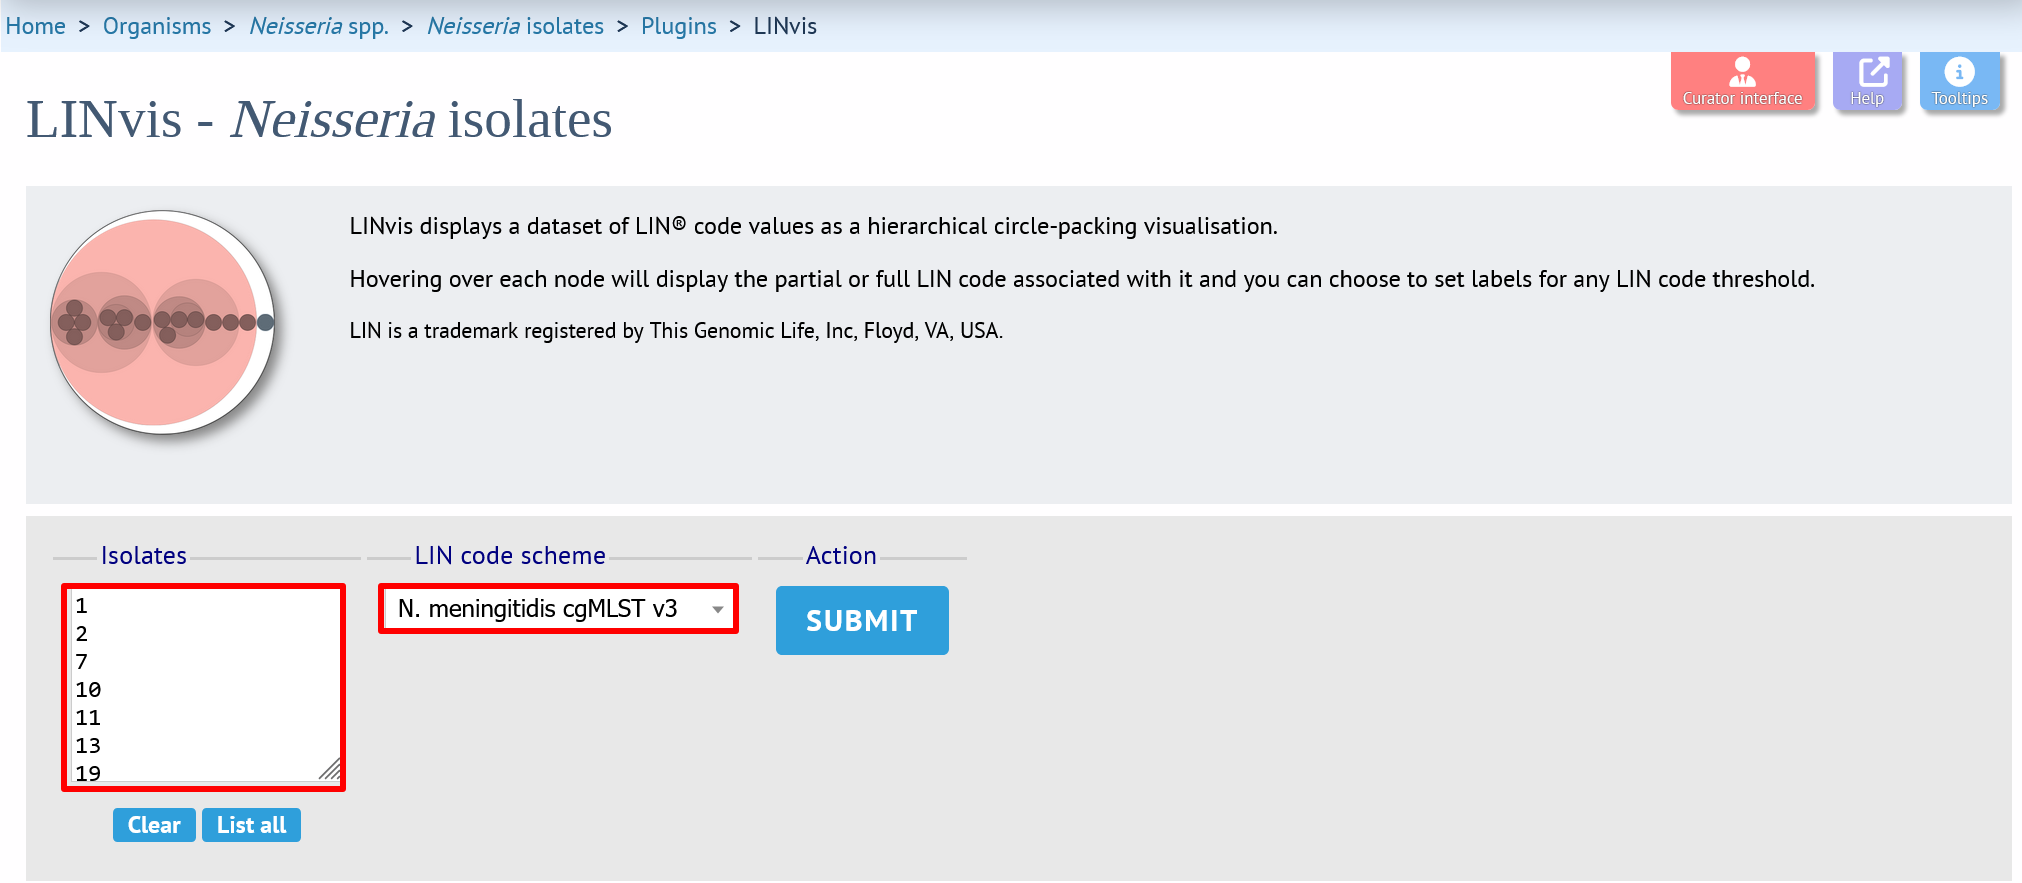
Select the isolates to include. If there is more than one scheme in the database that has LIN codes assigned, then select the required scheme.
Click ‘Submit’ to start the analysis.
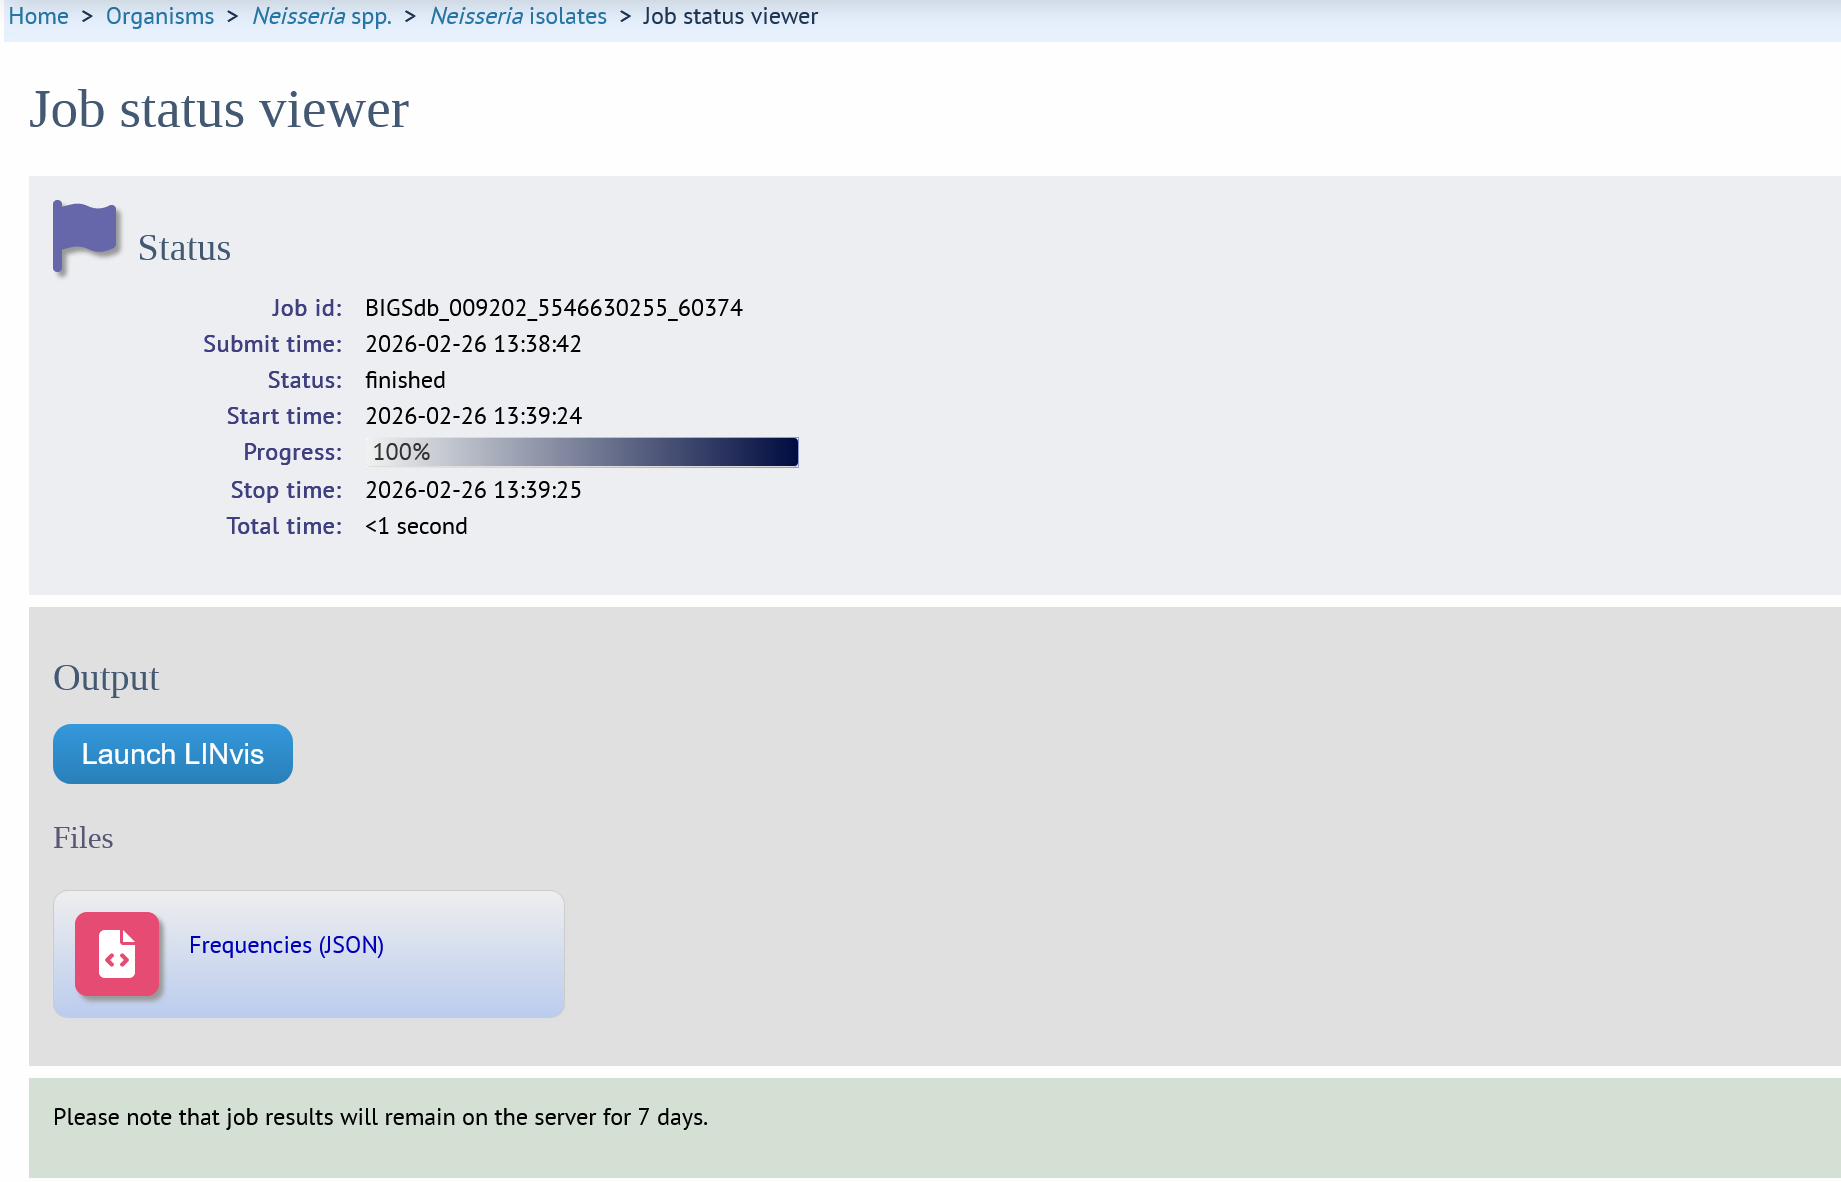
The job will be sent to the job queue. When it has finished, you will see separate buttons to launch the circle packing and sunburst visualisations. Click the button for the visualisation you want. There will also be a JSON format data file that you can download. This can be loaded into the LINvis viewer manually if you open the viewer page without passing a job parameter.
Circle packing
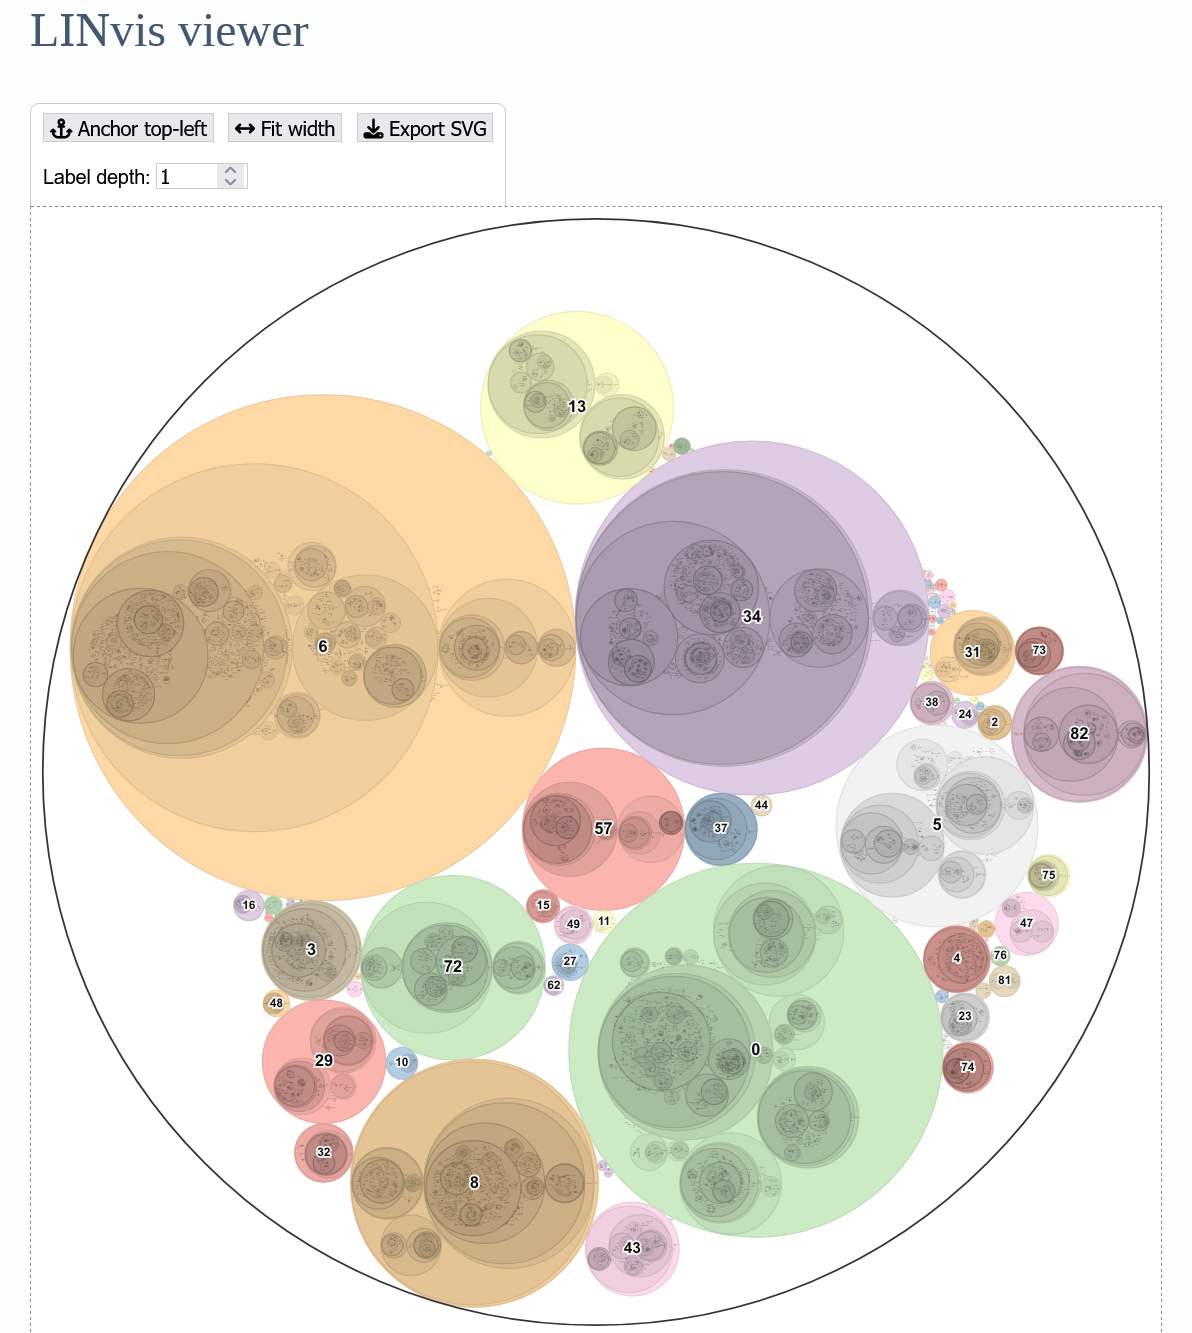
In this visualisation, each LIN code is displayed as a leaf node within a series of containing circles representing higher-level LIN code thresholds. The size of the leaf nodes is proportional to the number of isolates with that LIN code. It is important to note, however, that other nodes are constrained by the packing of descendents, so outer nodes may have inconsistent sizes even when their leaf totals are the same. The size of outer nodes is more dependent on the number of unique inner nodes and how they branch.
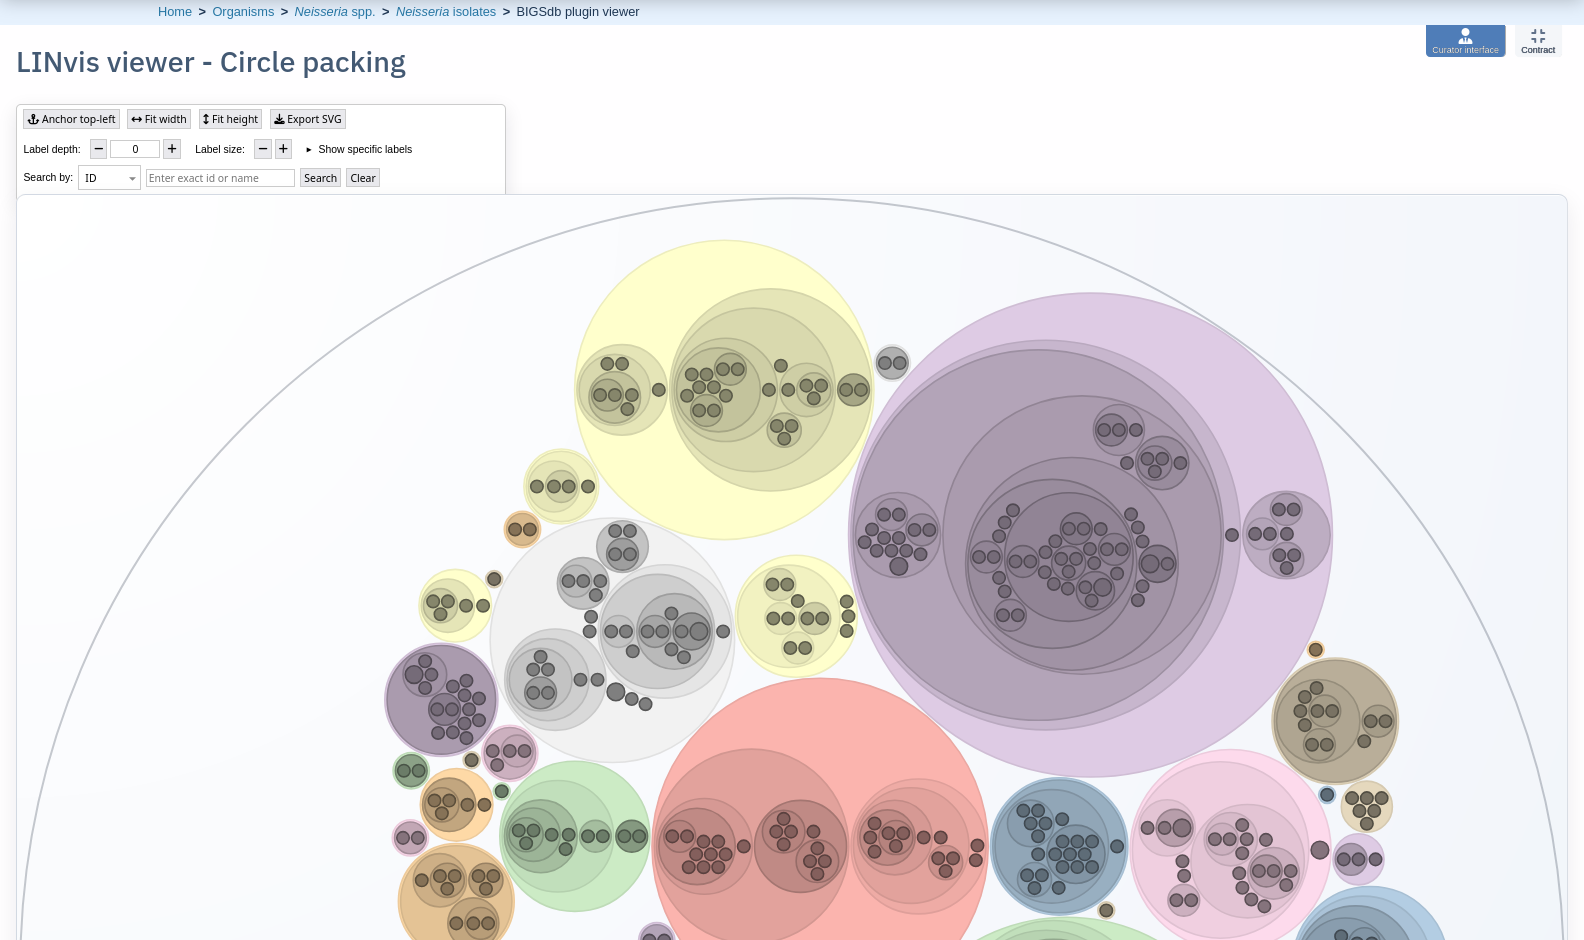
The visualisation can be panned (mouse drag or touch) or zoomed (mouse wheel or pinch touch).
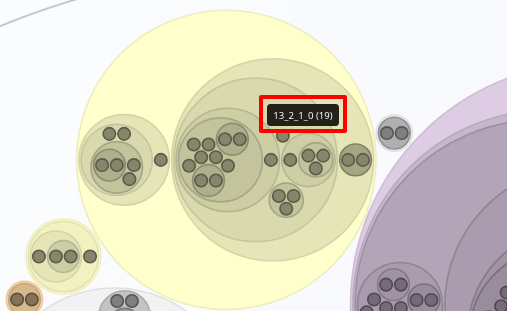
Hovering over any node will show a tooltip with the partial or full LIN code prefix represented by the node and its frequency.
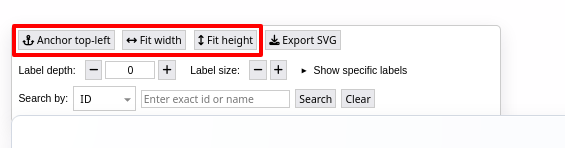
The display can be resized to fit the horizontal or vertical visible space, or moved to the top-left position, using the controls.
Labelling
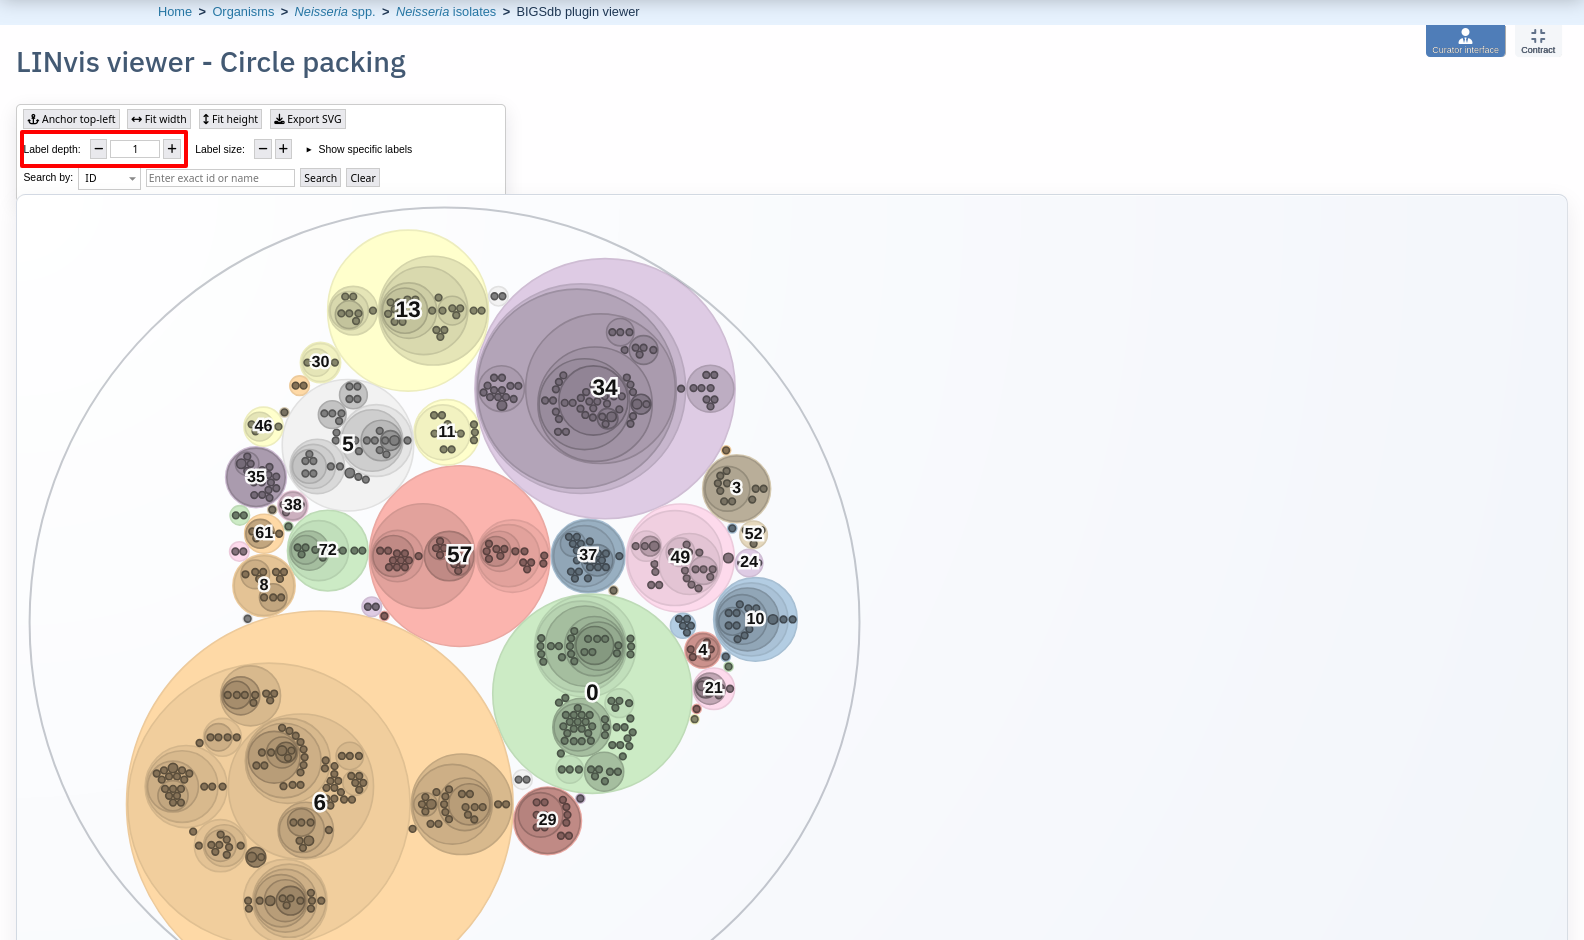
You can use automatic labelling of a selection of nodes using the ‘Label depth’ control. For example, set this to 1 to show labels for the first LIN threshold. The size of the labels can also be changed.
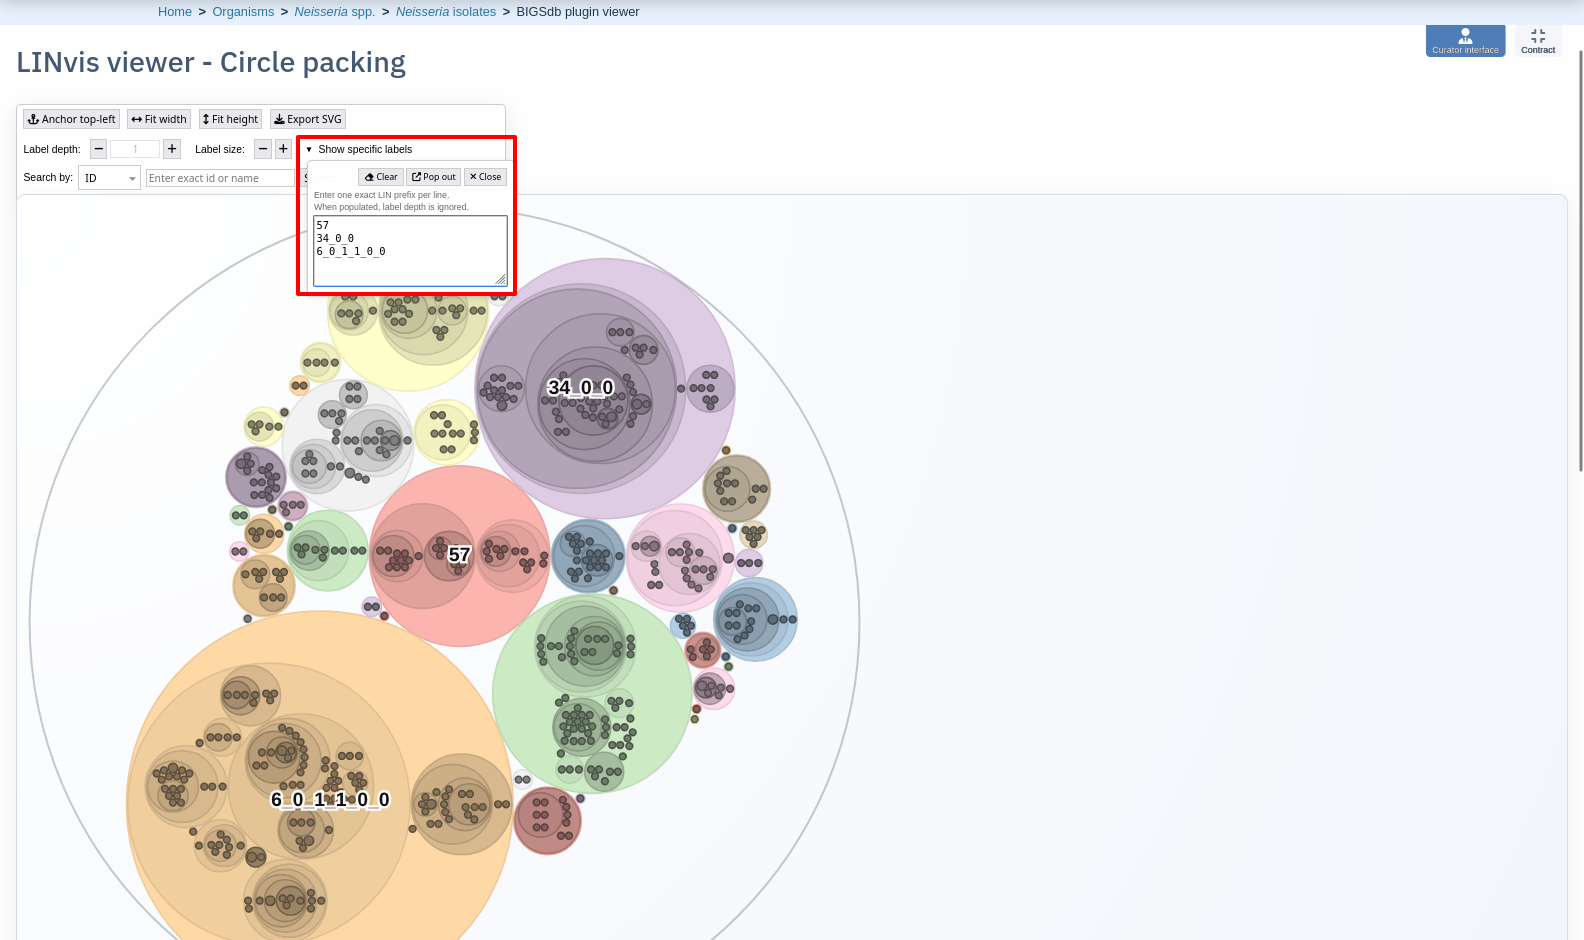
You will often have specific LIN prefixes that you want to label. In this case, you can click the ‘Show specific labels’ control and enter a list. The list can contain any number of LIN prefixes at a mixture of thresholds. This overrides the label depth setting.
Searching by isolate
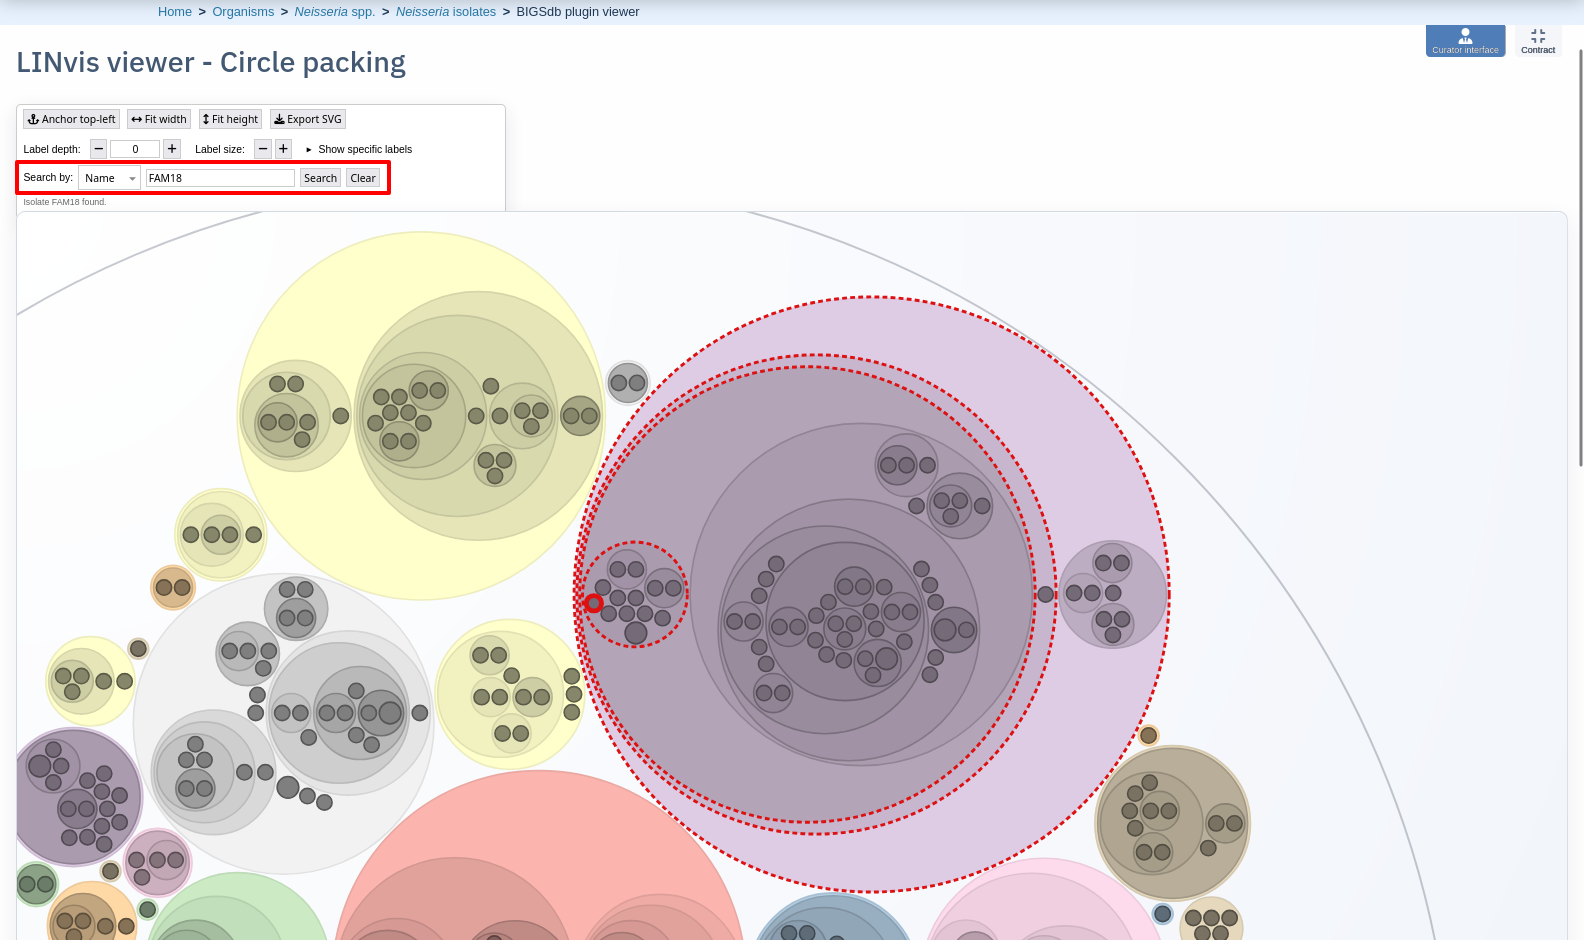
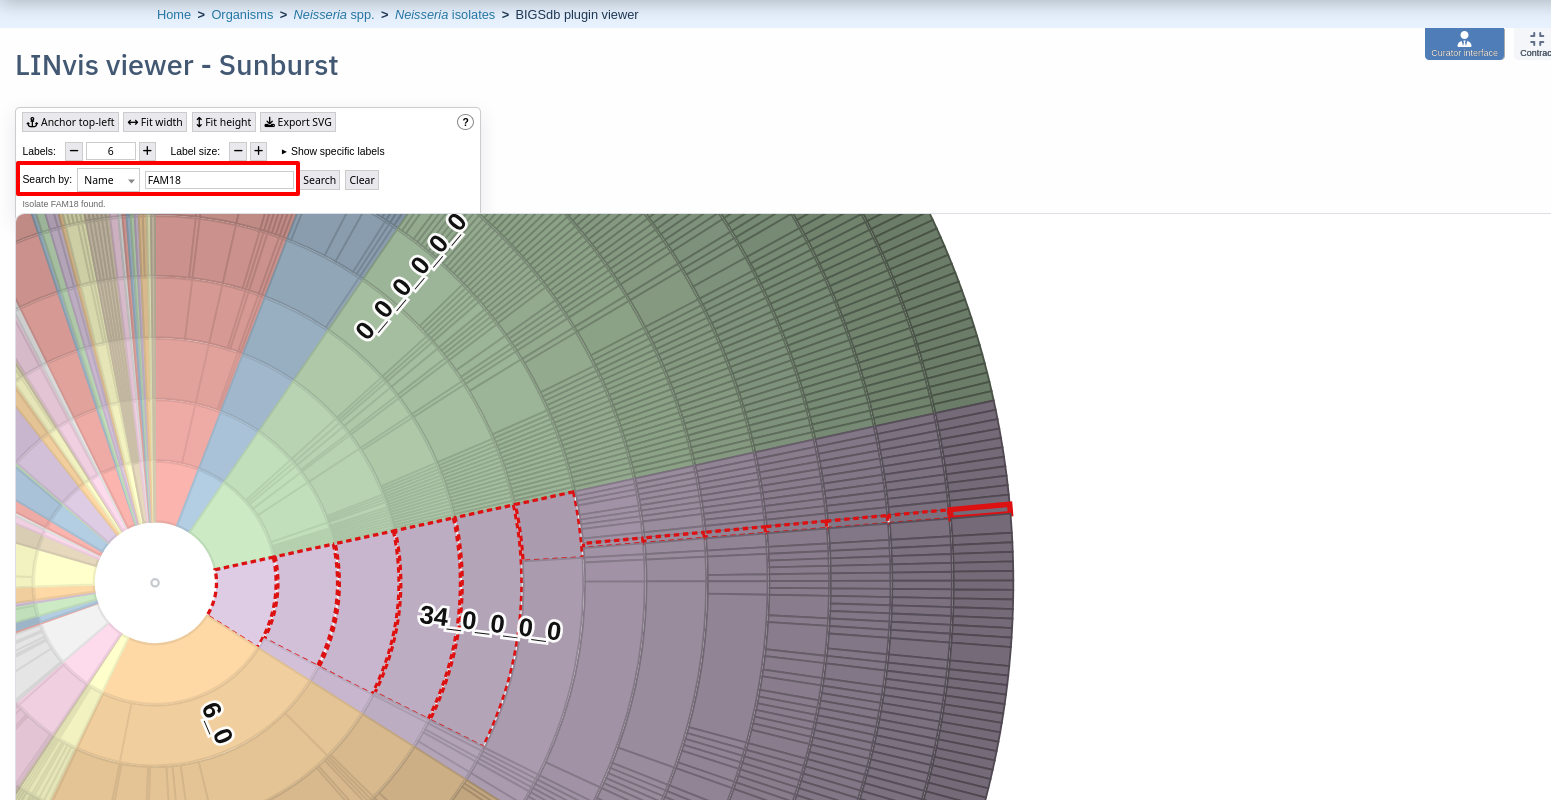
You can search the visualisation for the location of a particular isolate either using its name of its database id. If the isolate is found, every outer threshold ring containing it is highlighted in a dotted red line and the leaf node is highlighted with a solid red line.
Sunburst
Selecting the sunburst visualisation displays a series of concentric circles with each ring representing a different LIN threshold with each prefix value at that threshold sized proportionally to its frequency. Segments are coloured by the top-level threshold. Controls are similar to those for the circle packing, with the only difference being the automatic labelling using a count of labels with annotations showing the largest segments.
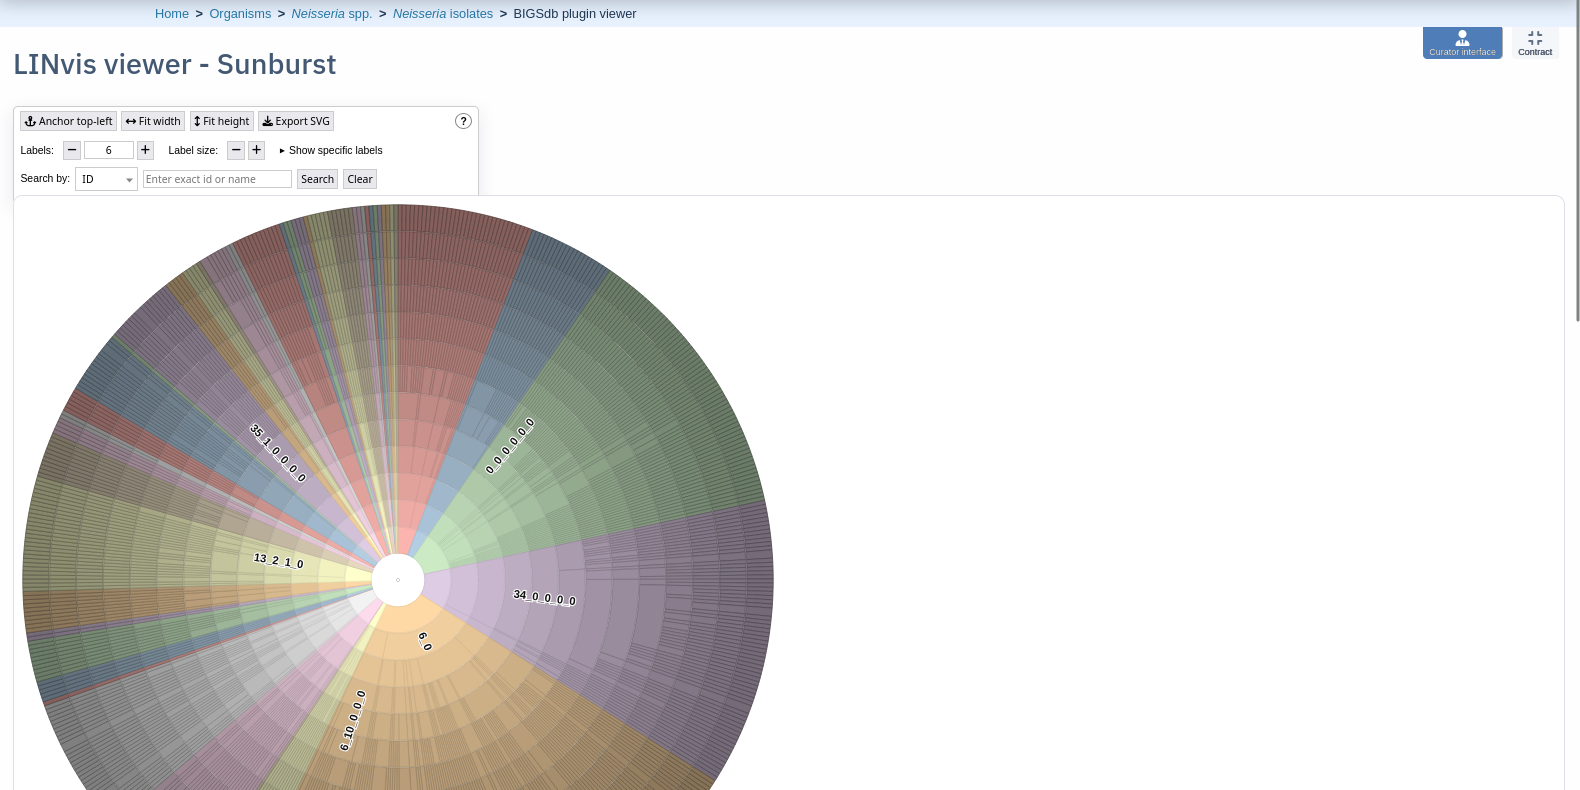
Searching for isolates works in exactly the same way as for circle packing, with each containing segment highlighted.
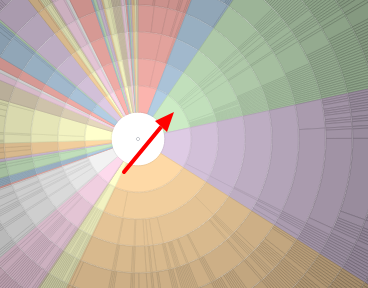
Clicking any segment will redraw the hierarchy centred on that position, e.g. clicking on the segment arrowed…
… shows the hierarchy where all records have the same top-level threshold value.
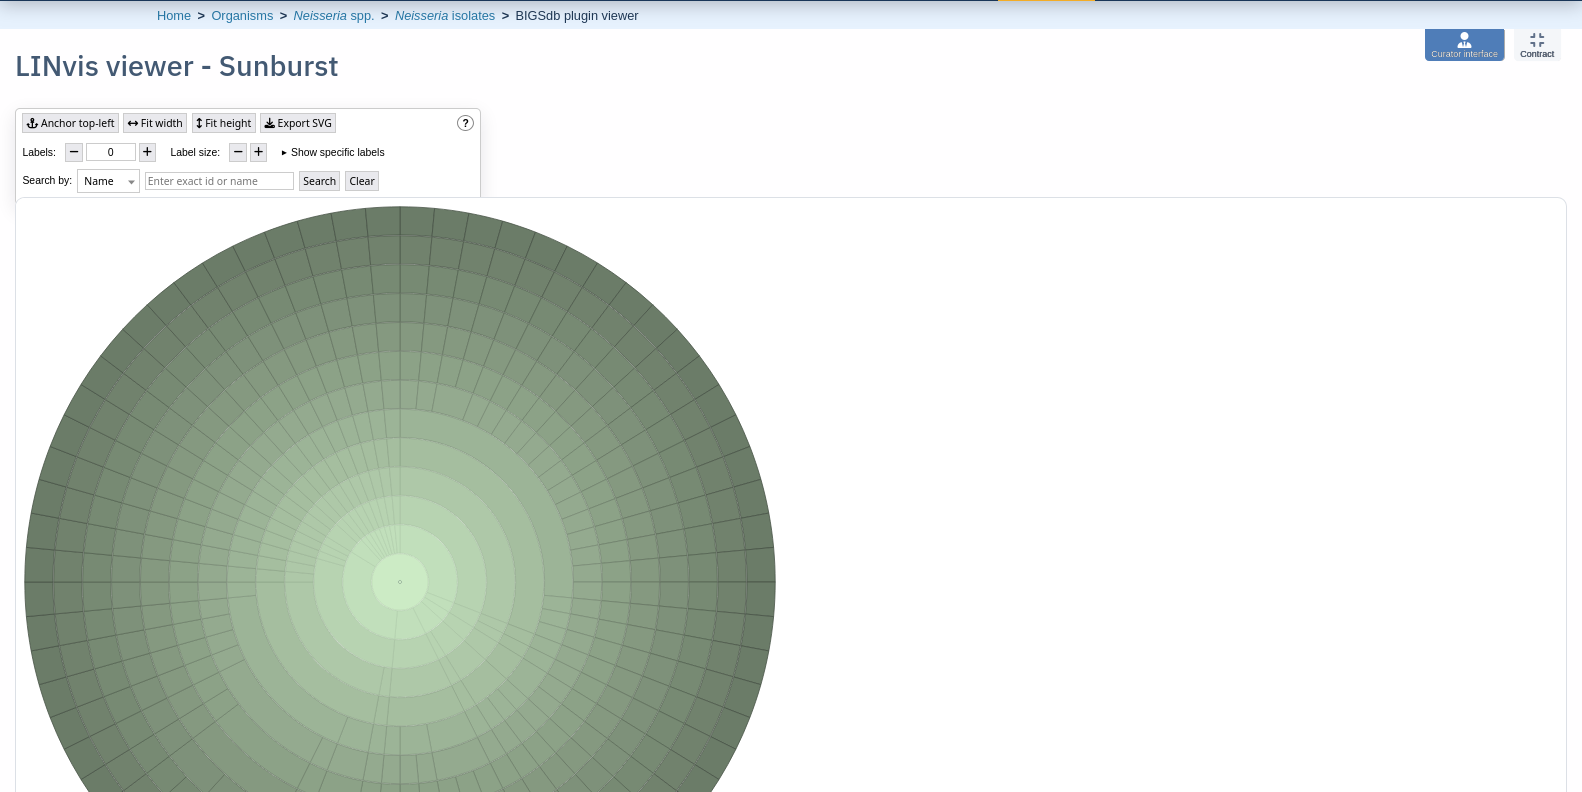
Clicking outside the outer circle will reset the view.